Escarlate: Gamification Dashboard
The "Escarlet Project" is an initiative of the Architecture department of Banco Santander with the objective of creating an interface that highlights the performance of the superintendents and managers of applications and projects within the bank.
Challenges
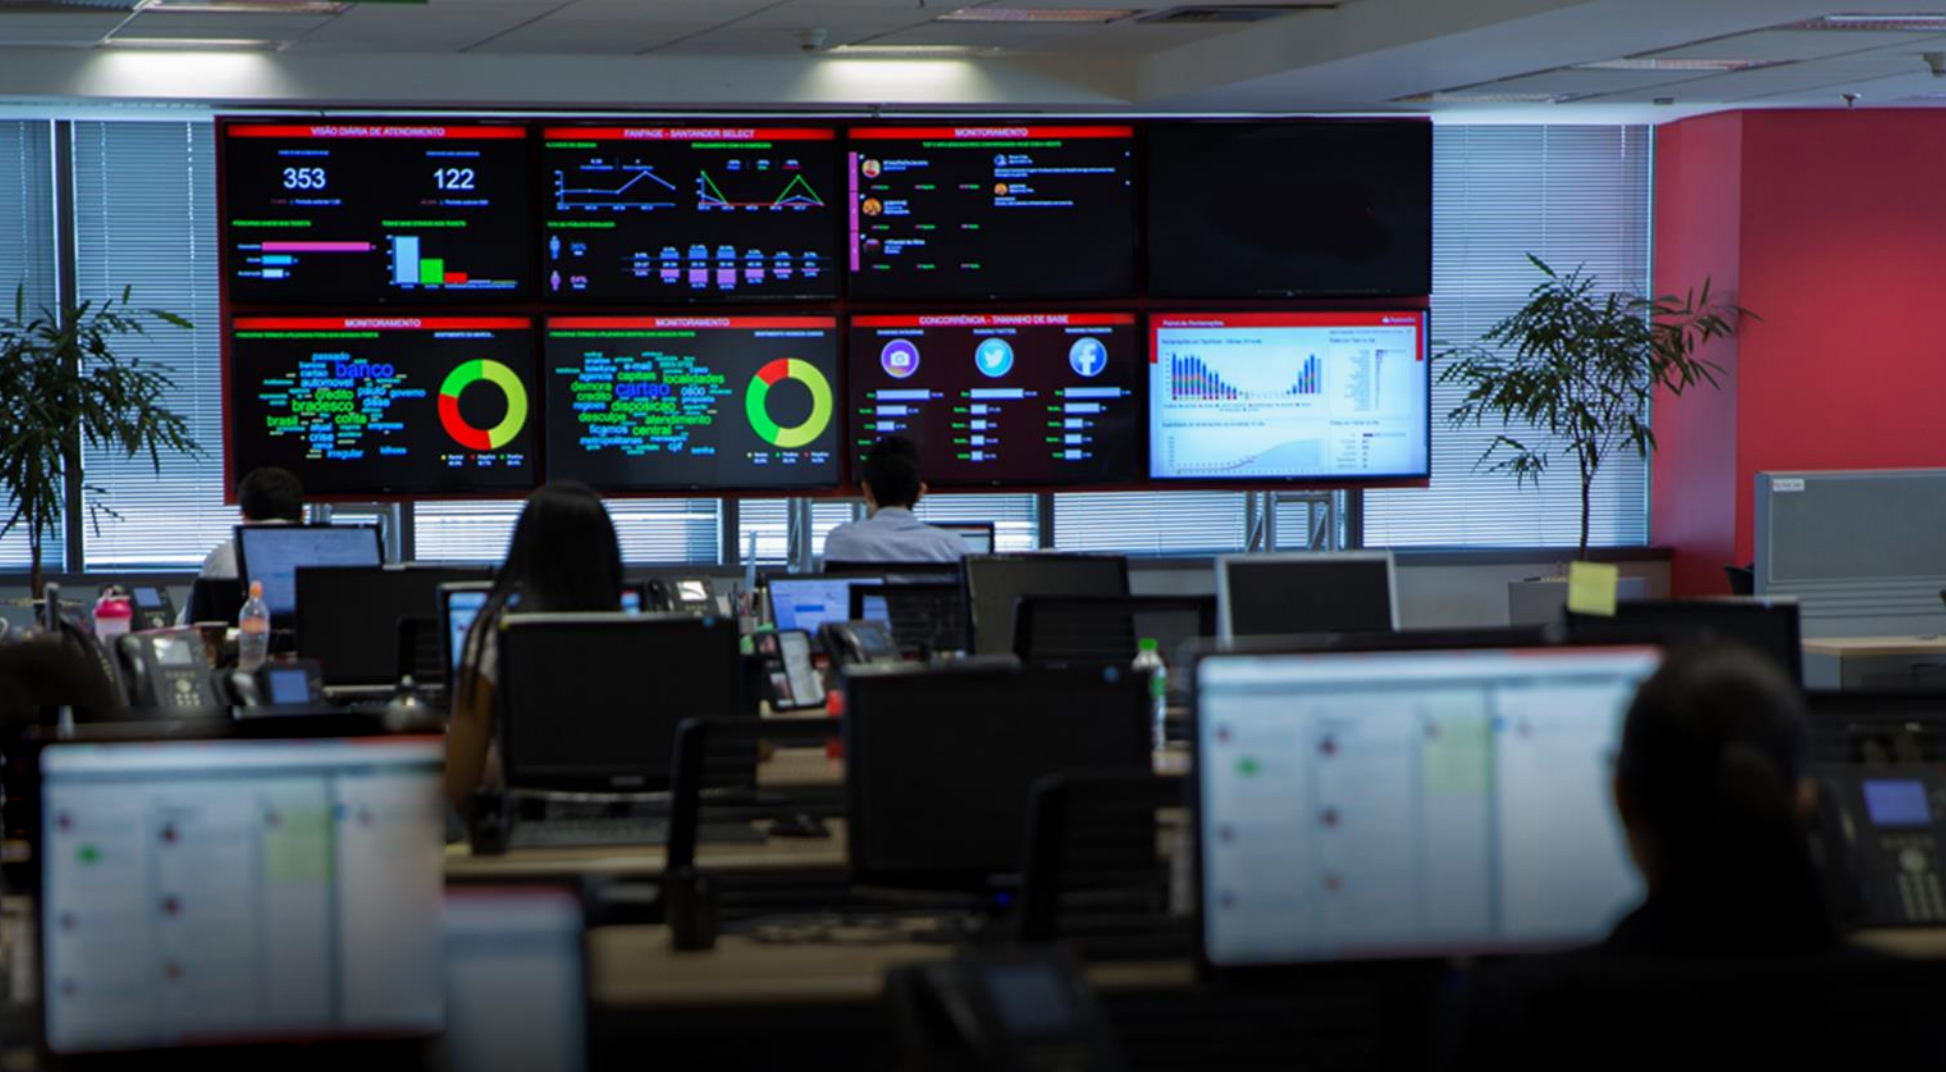
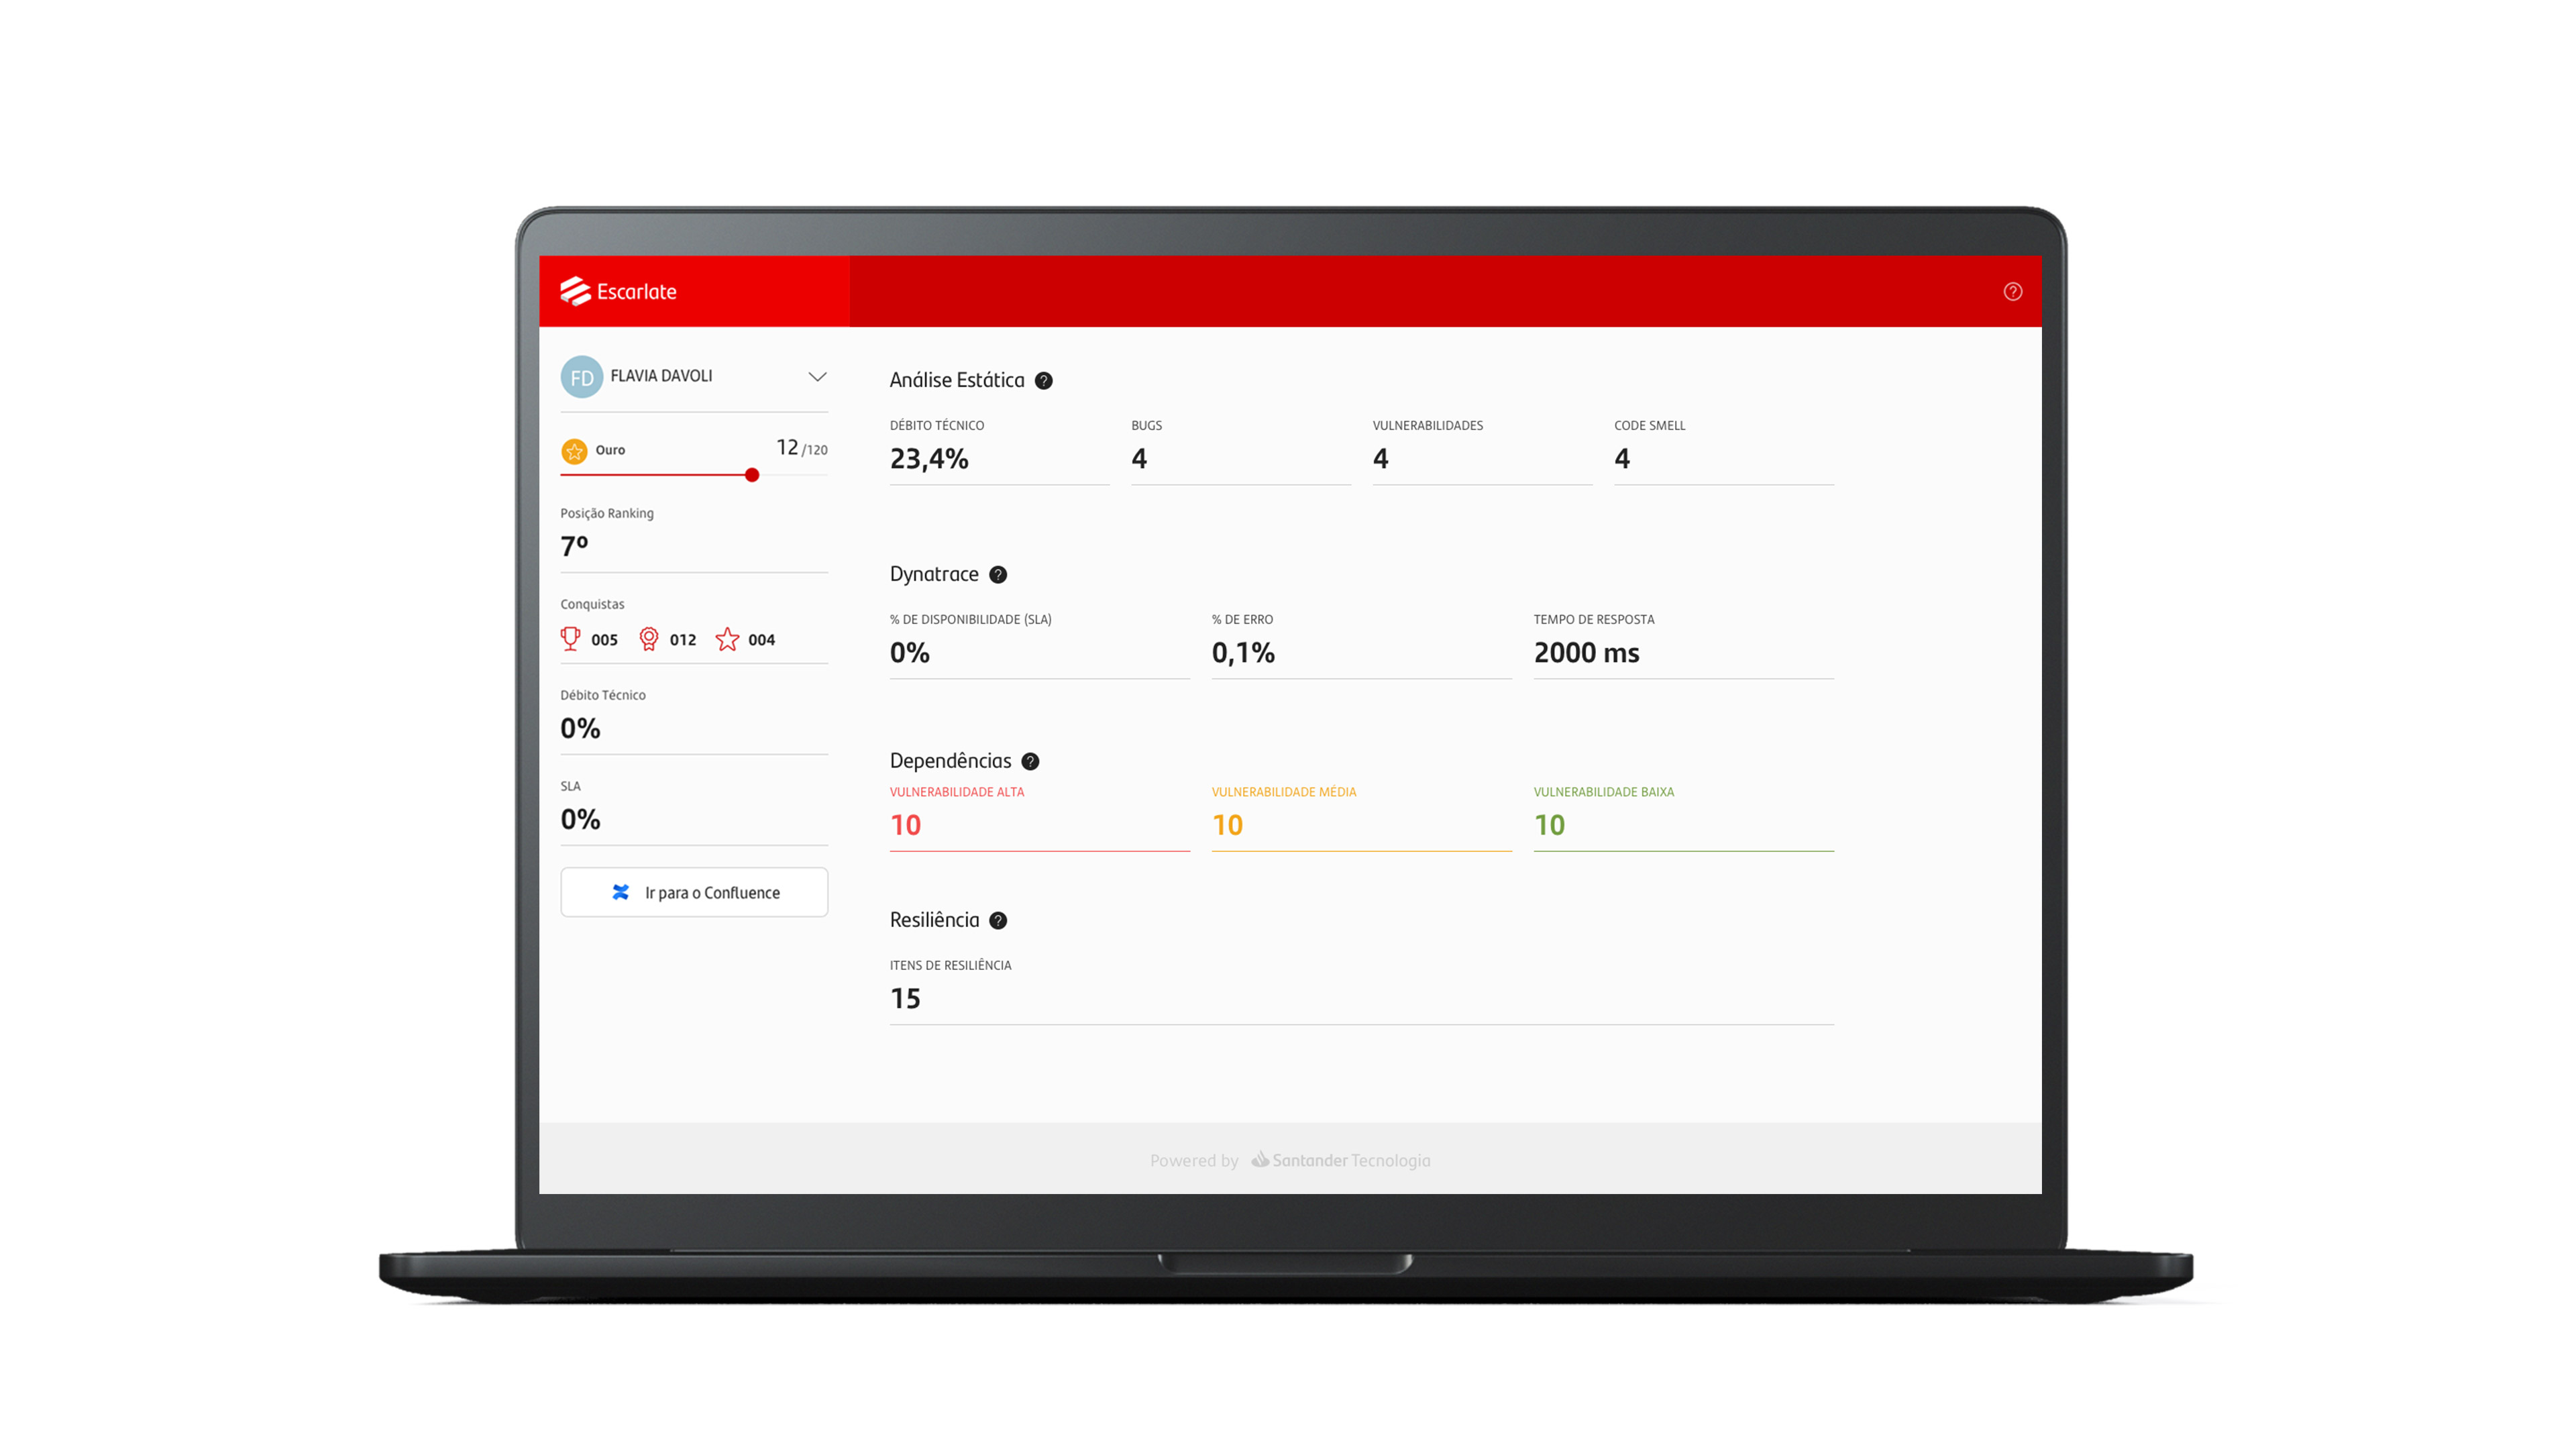
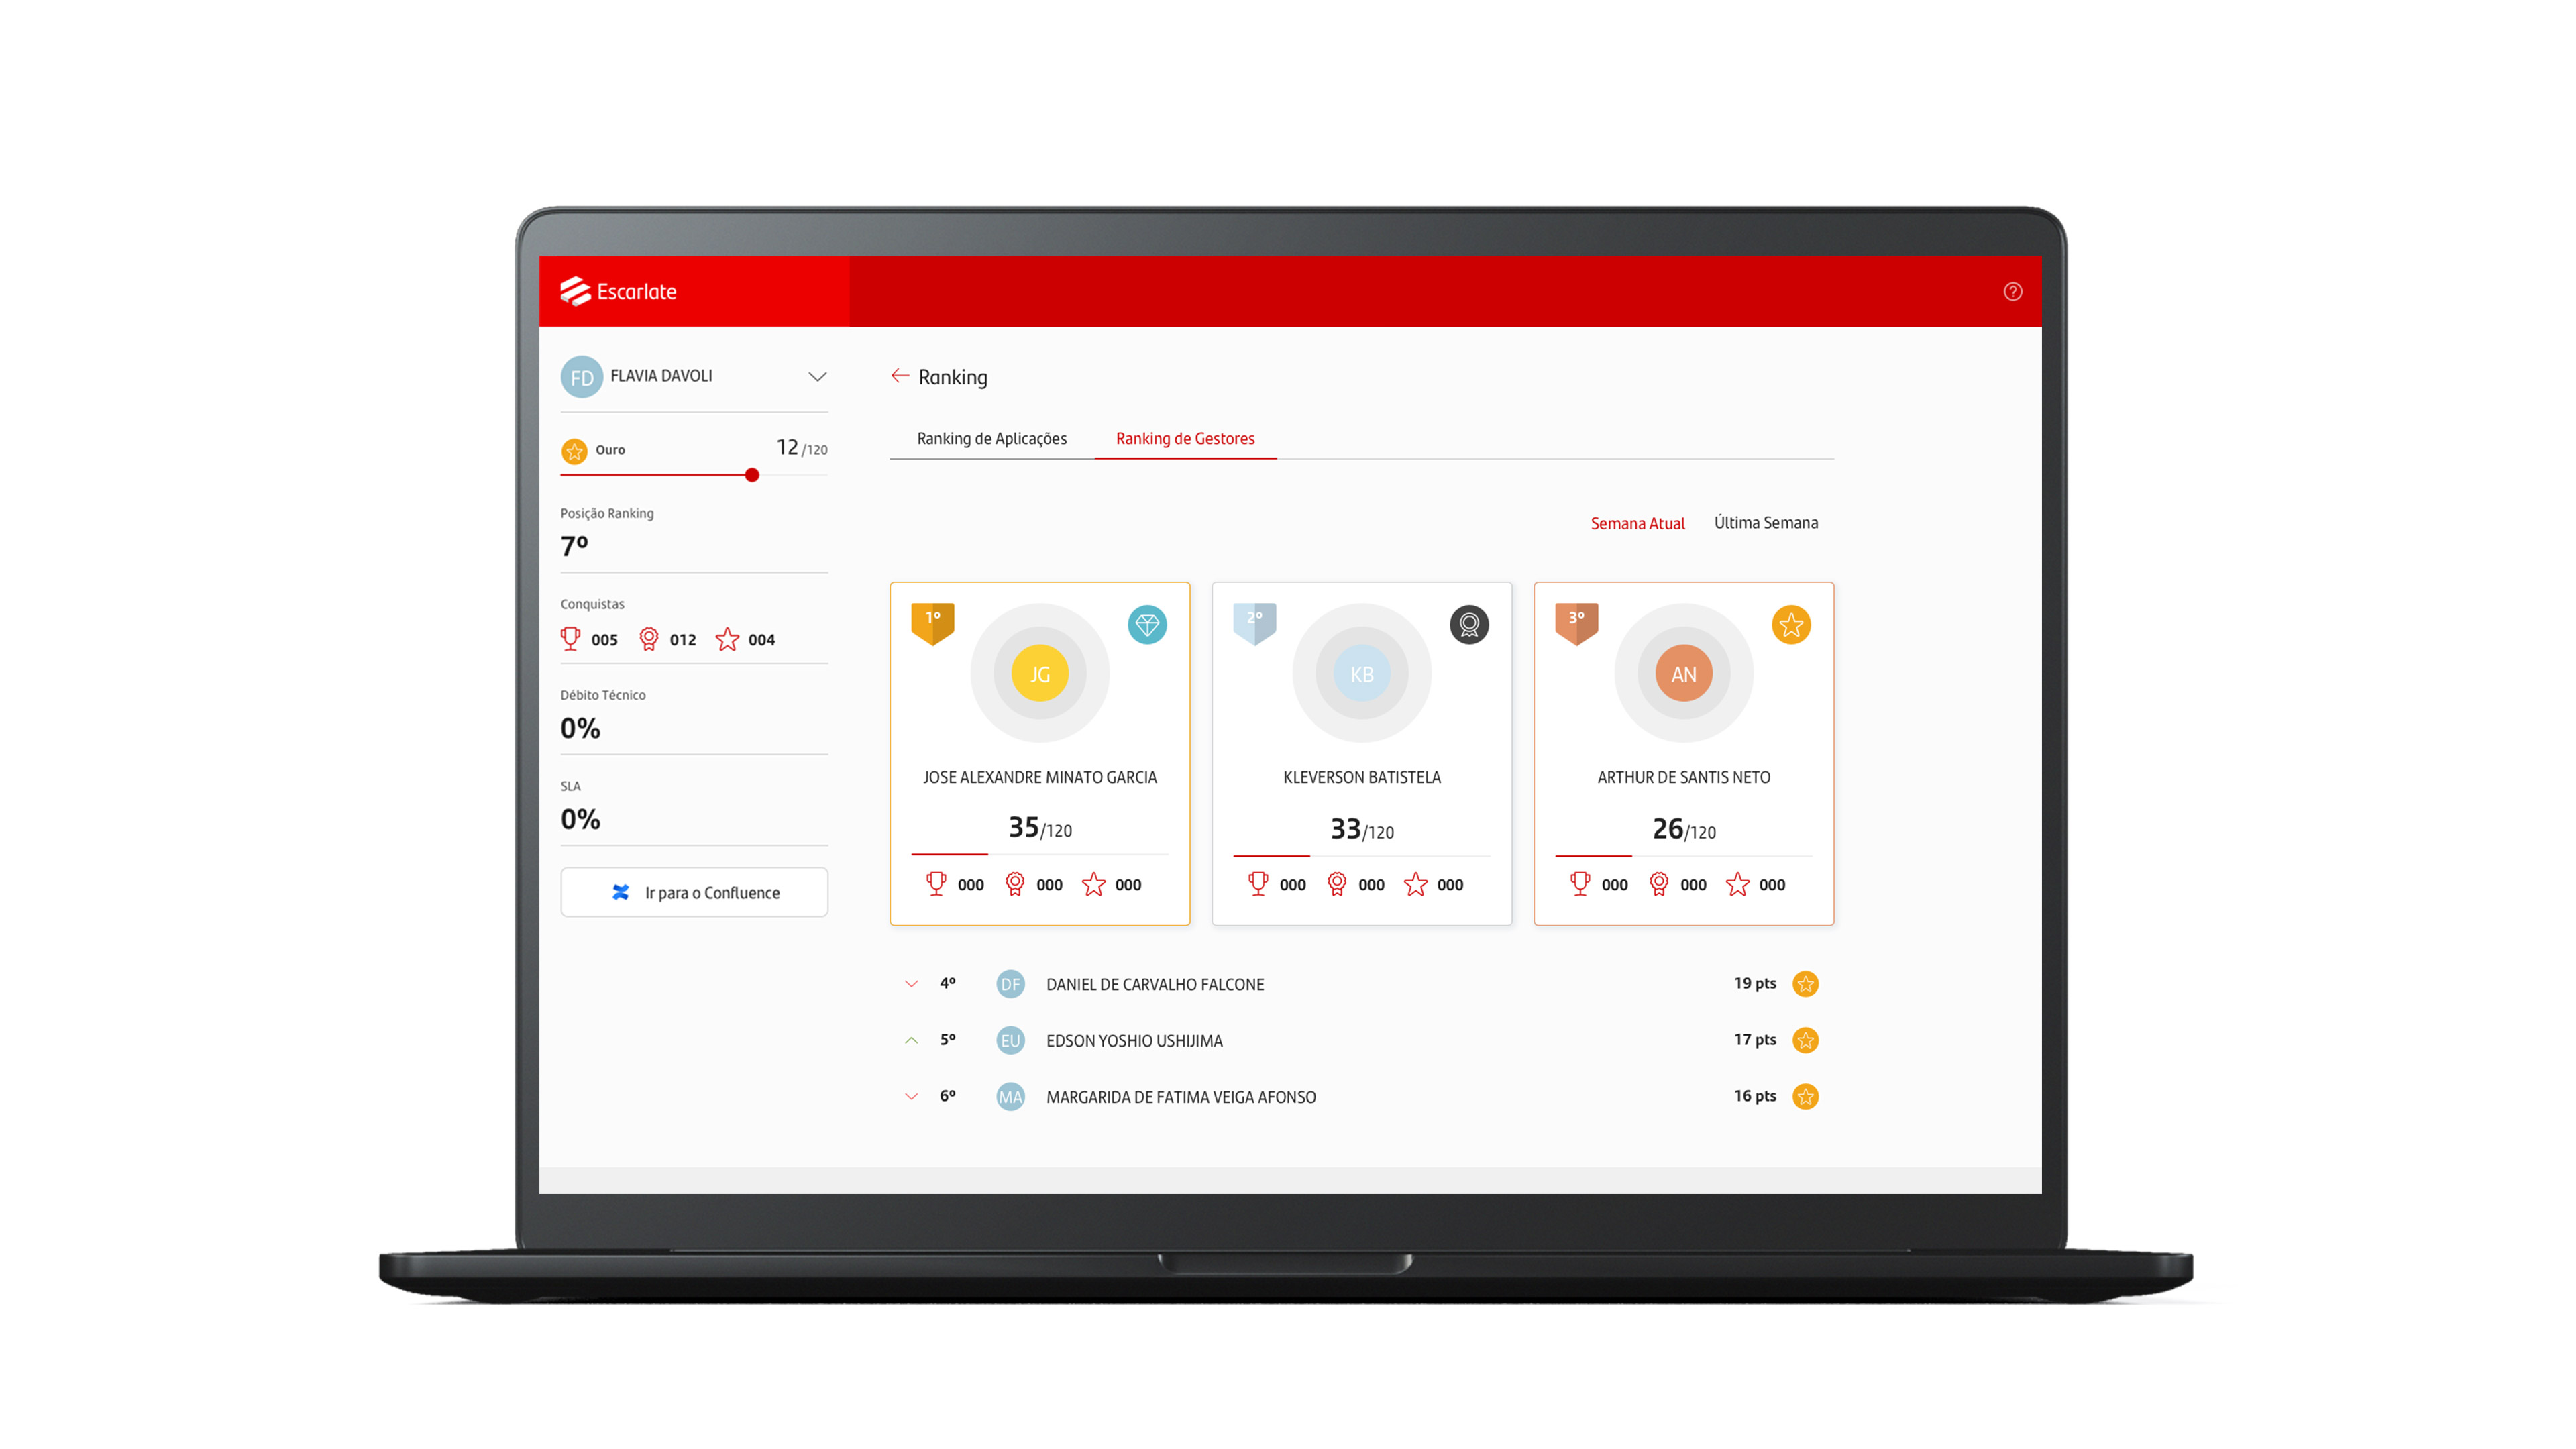
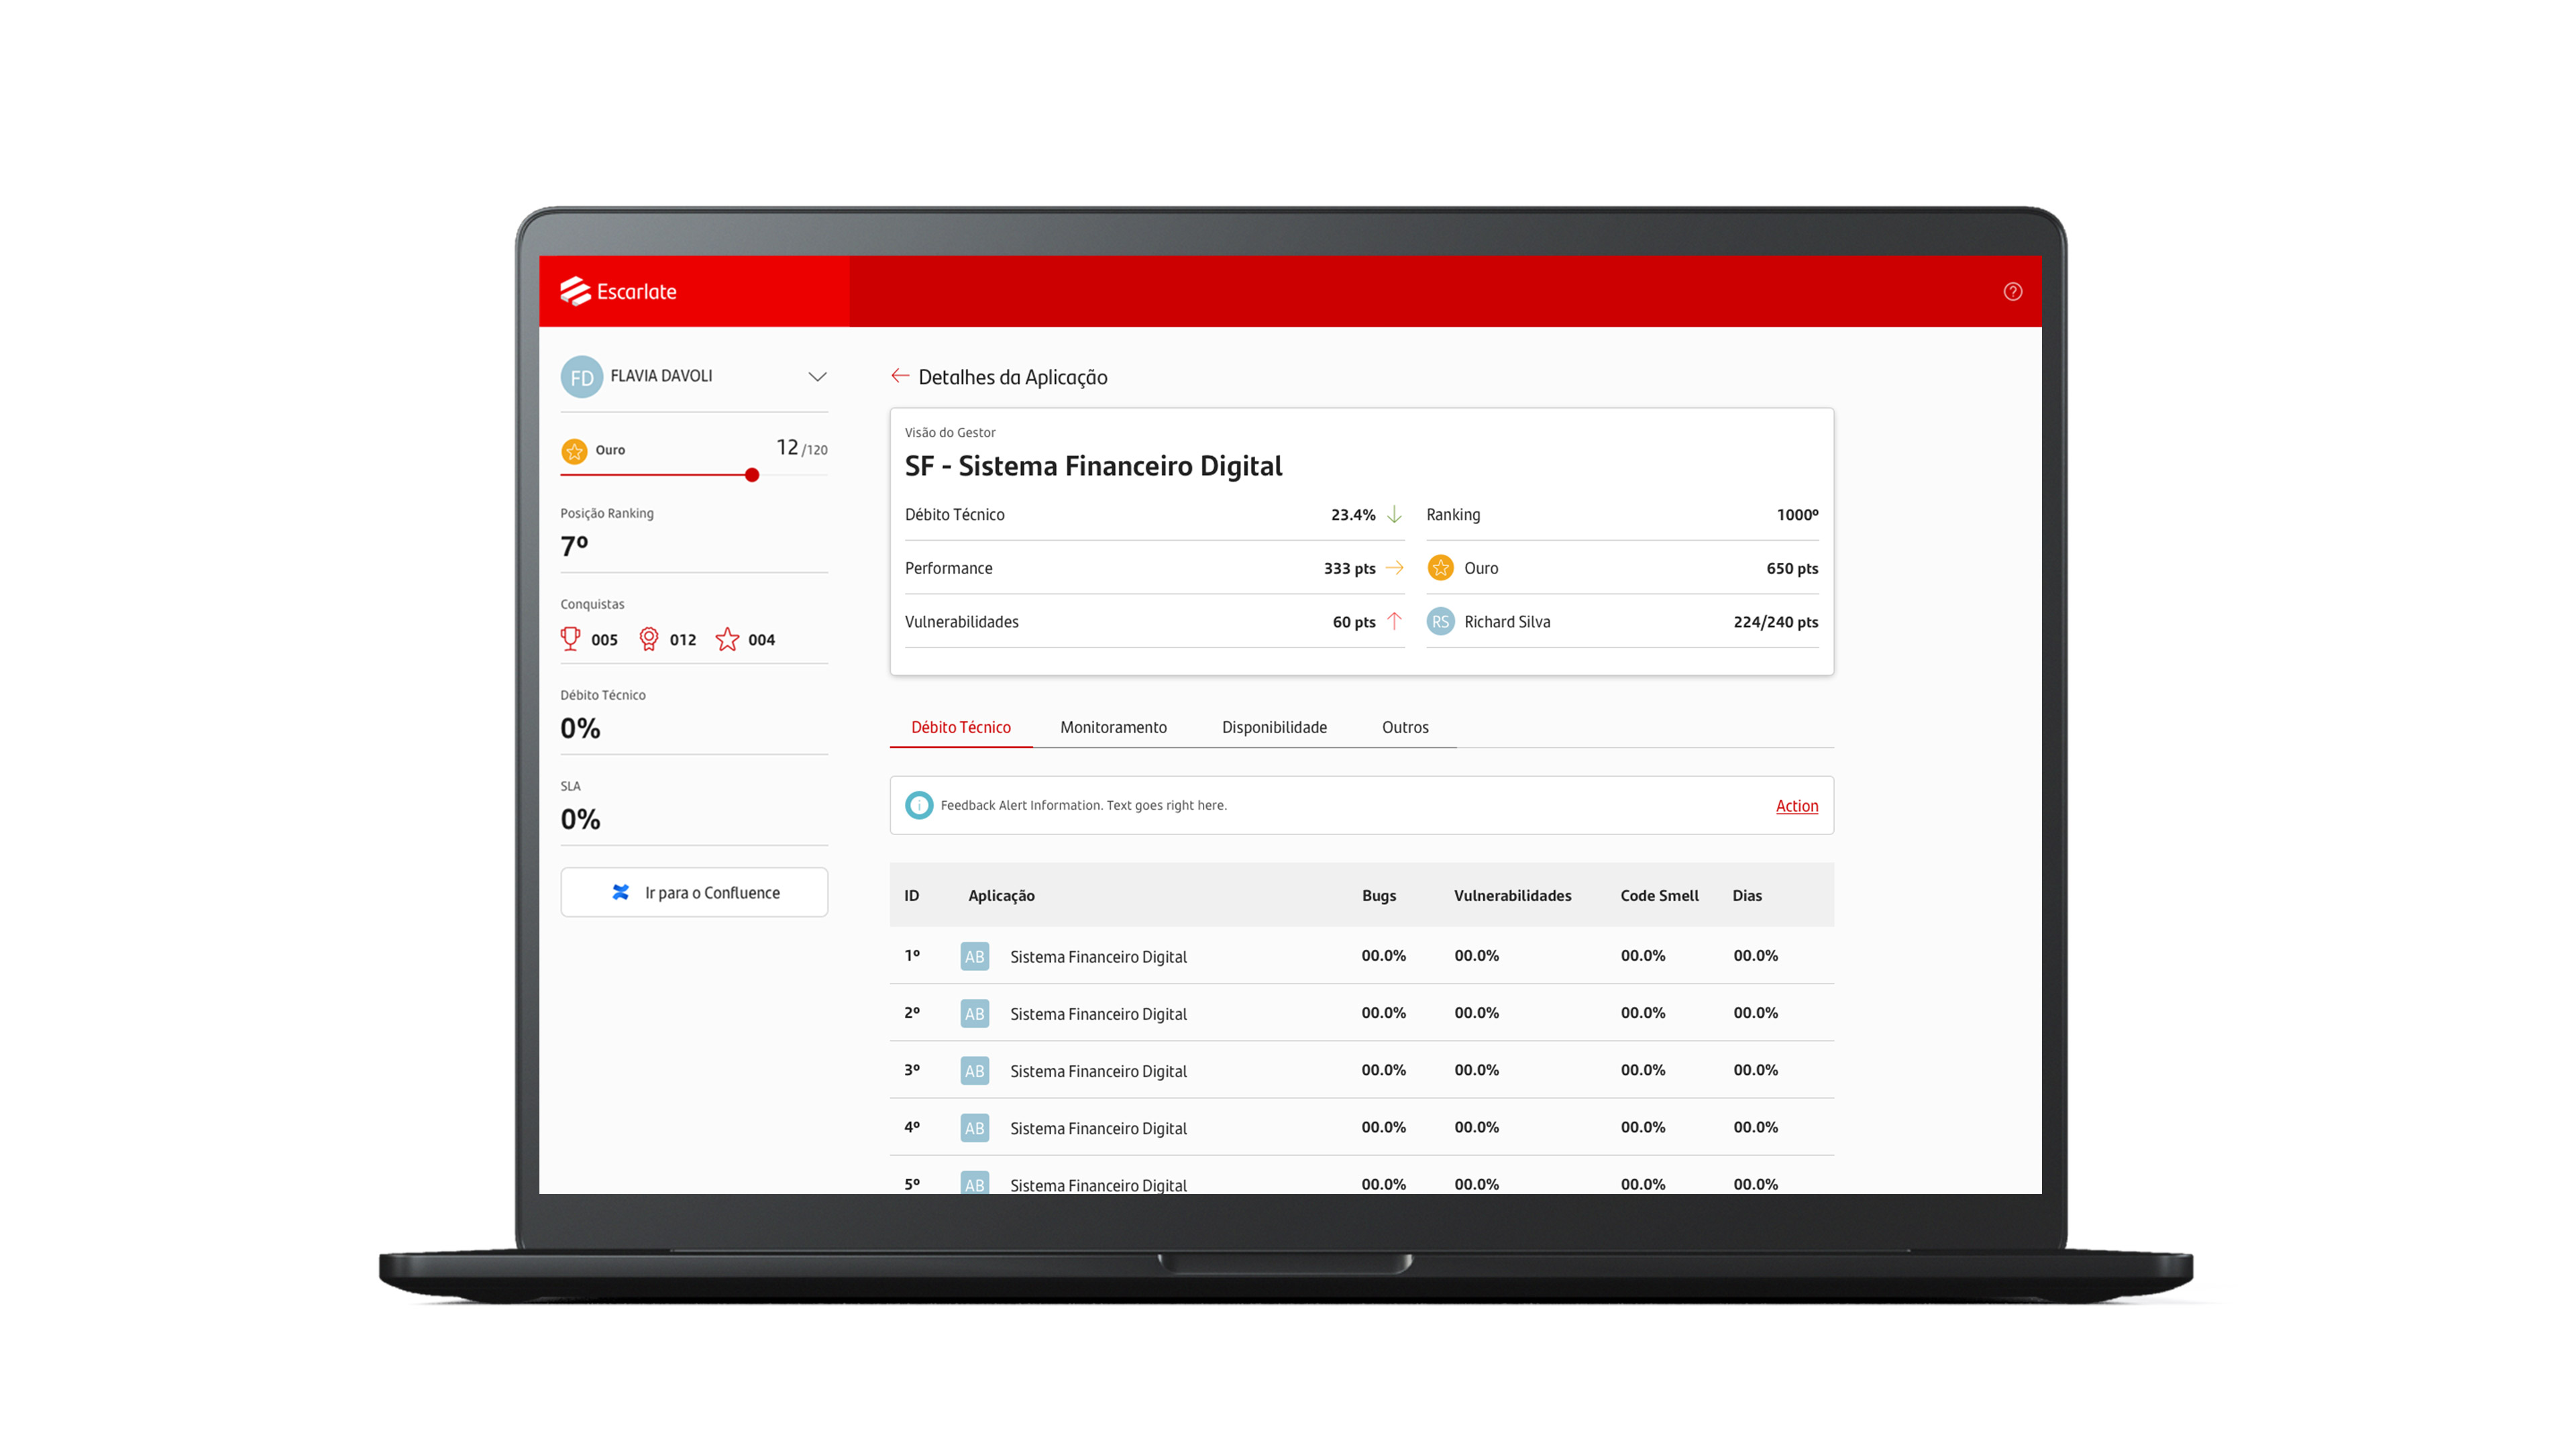
Another objective of this project is to use this monitor in status meetings held between the bank's CIO and superintendents, highlighting the main performance attributes of each application, such as budget, time, team size and cost, ROI, etc.
My Role
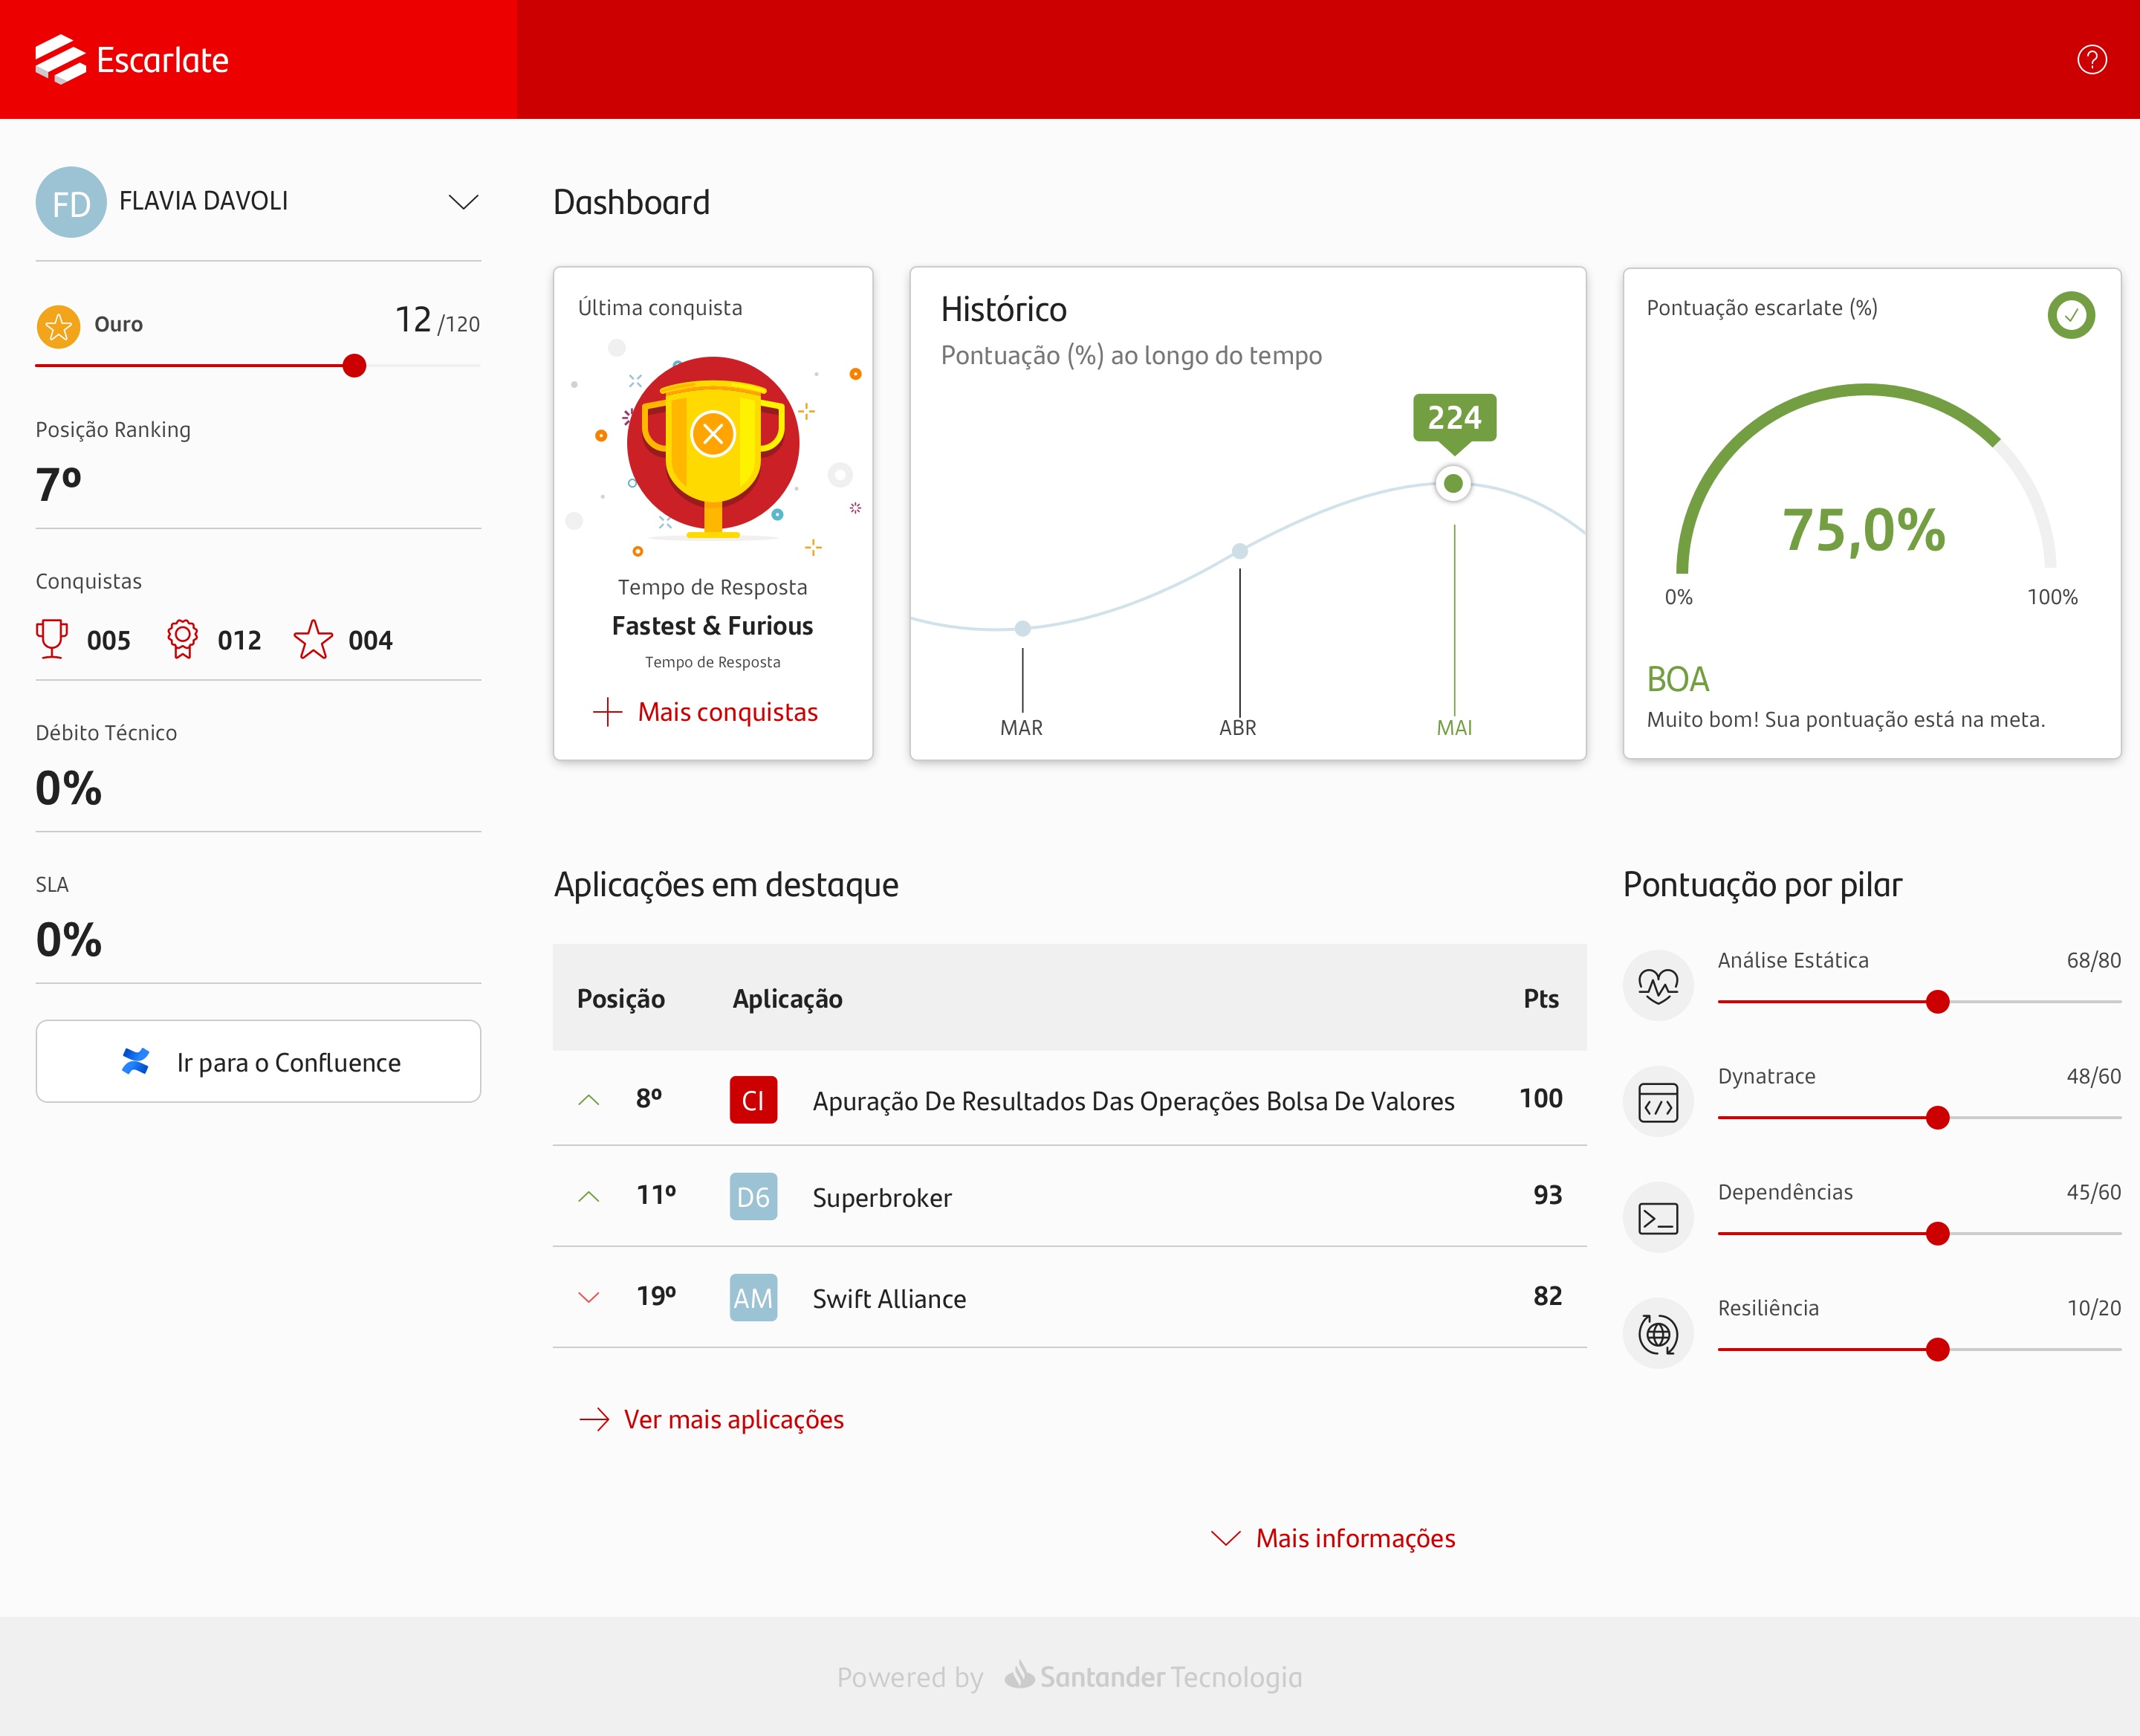
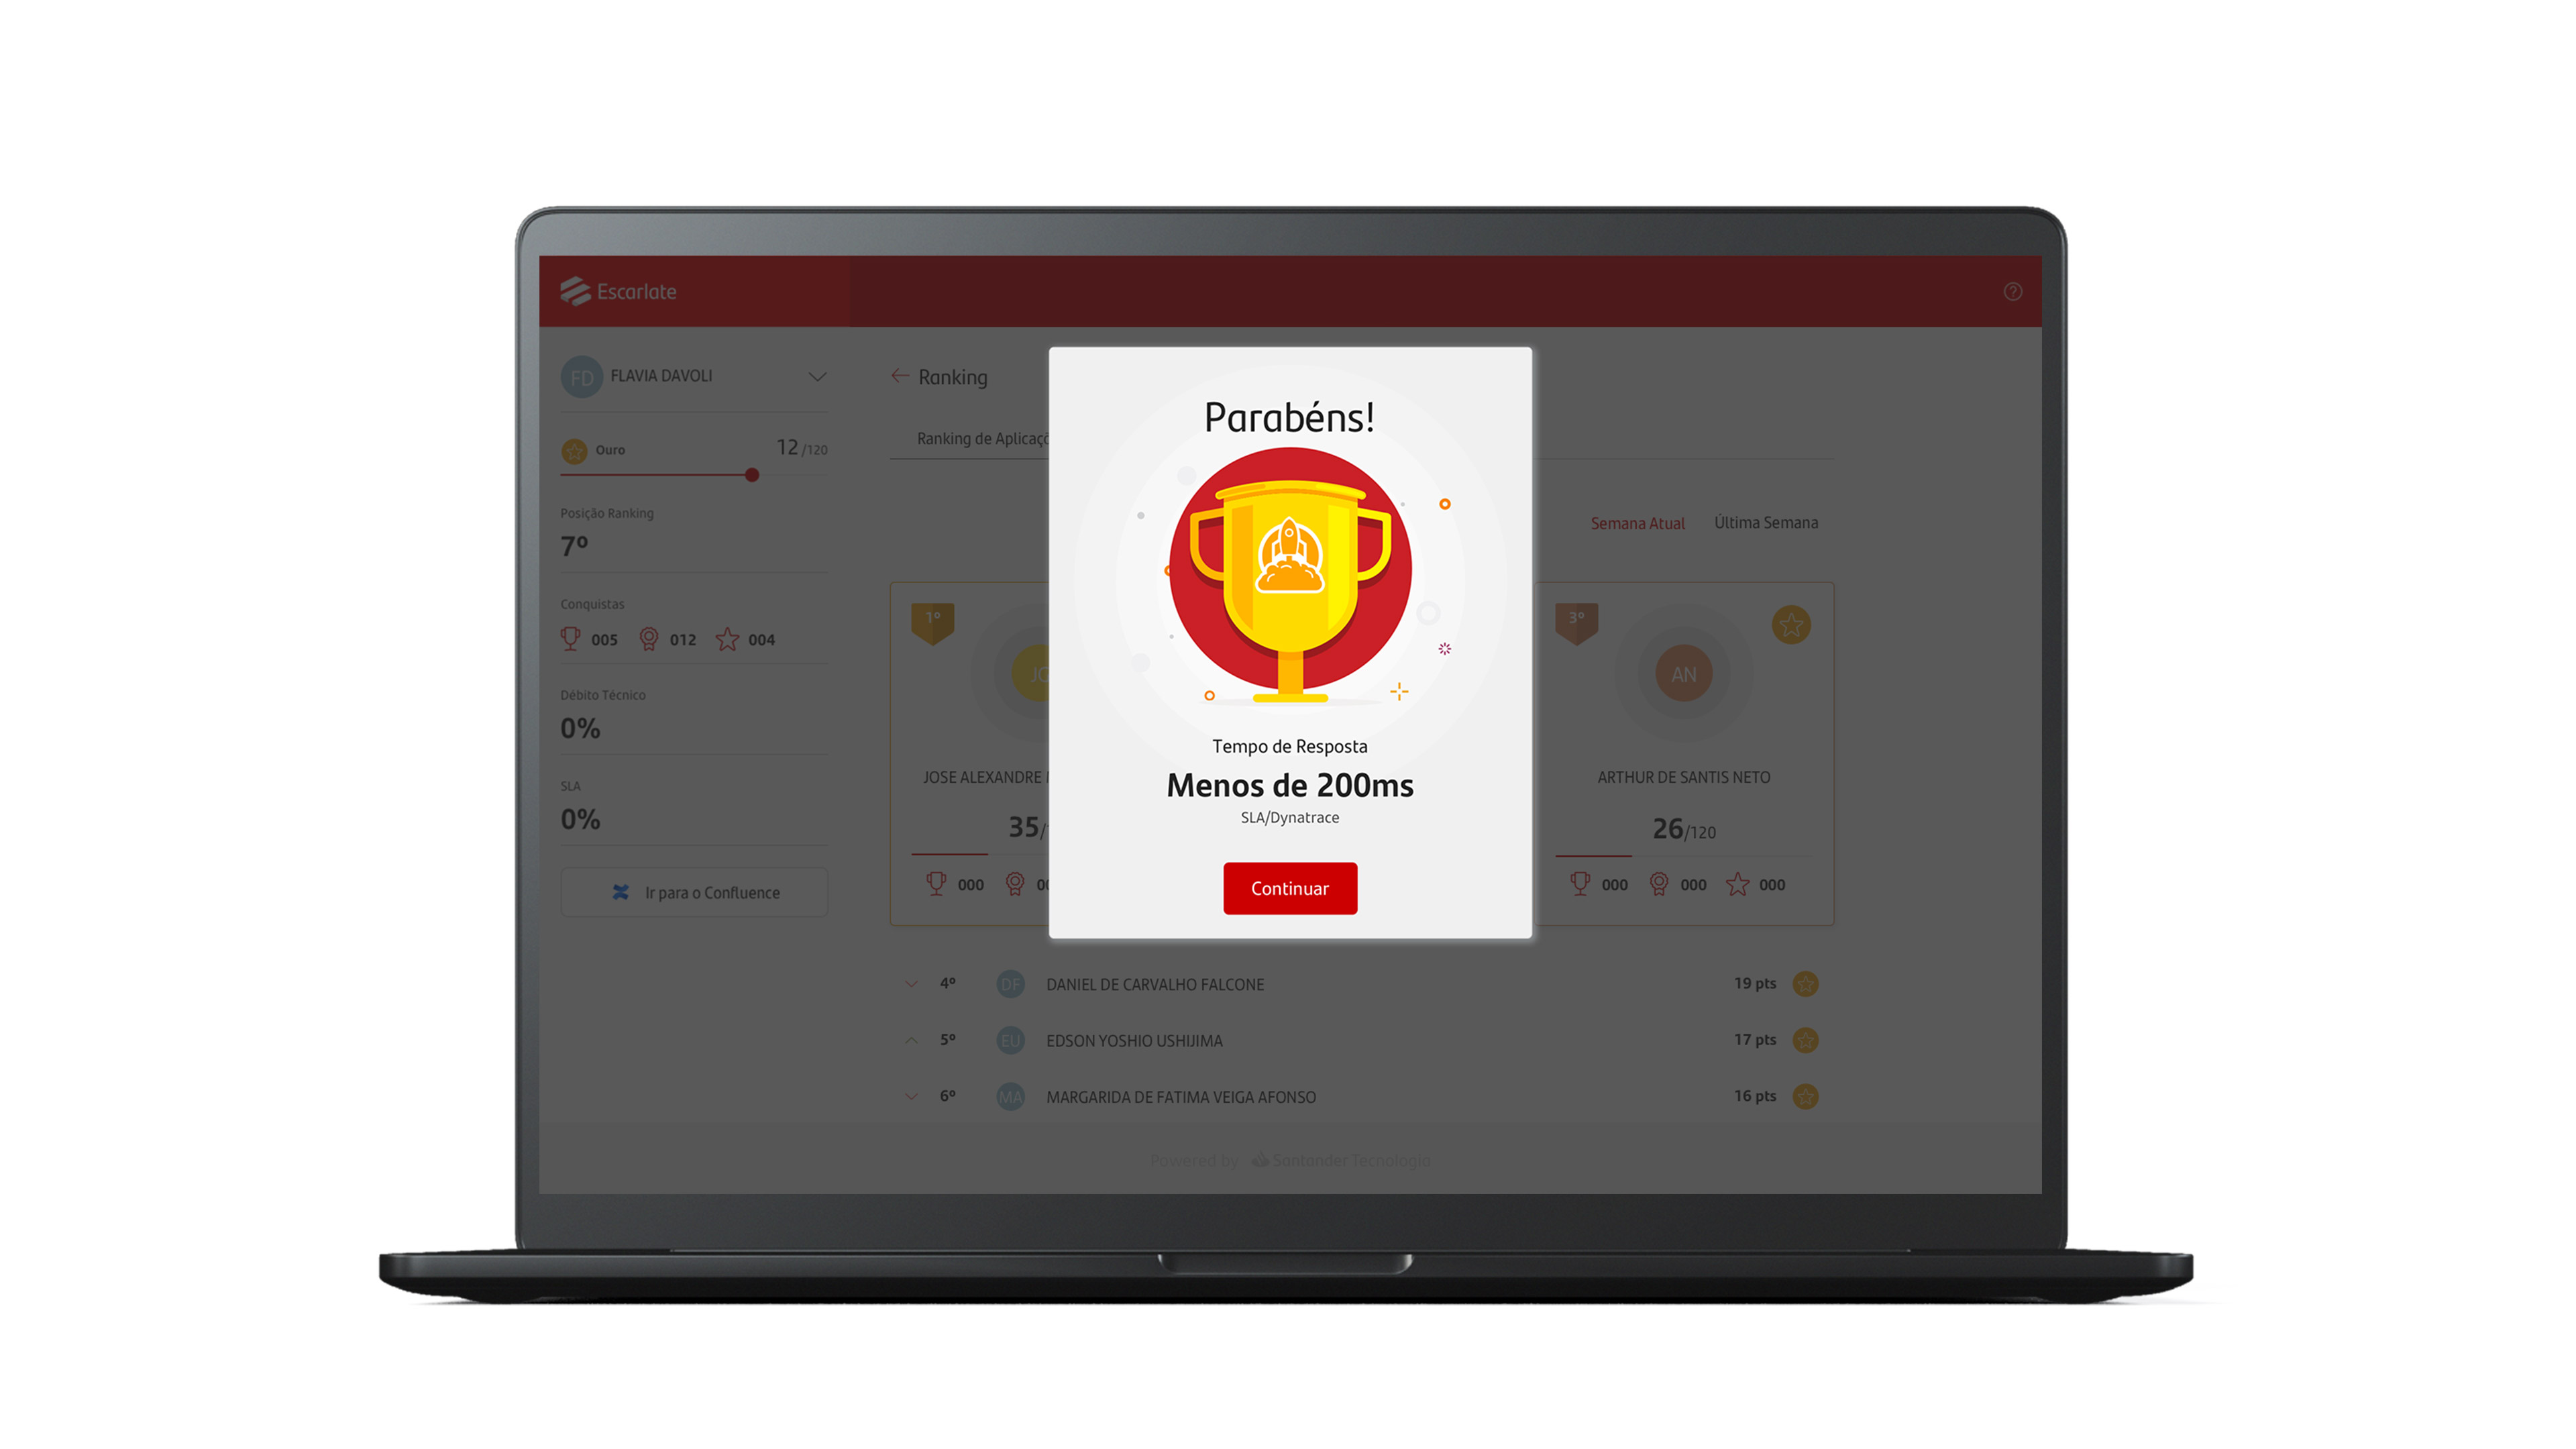
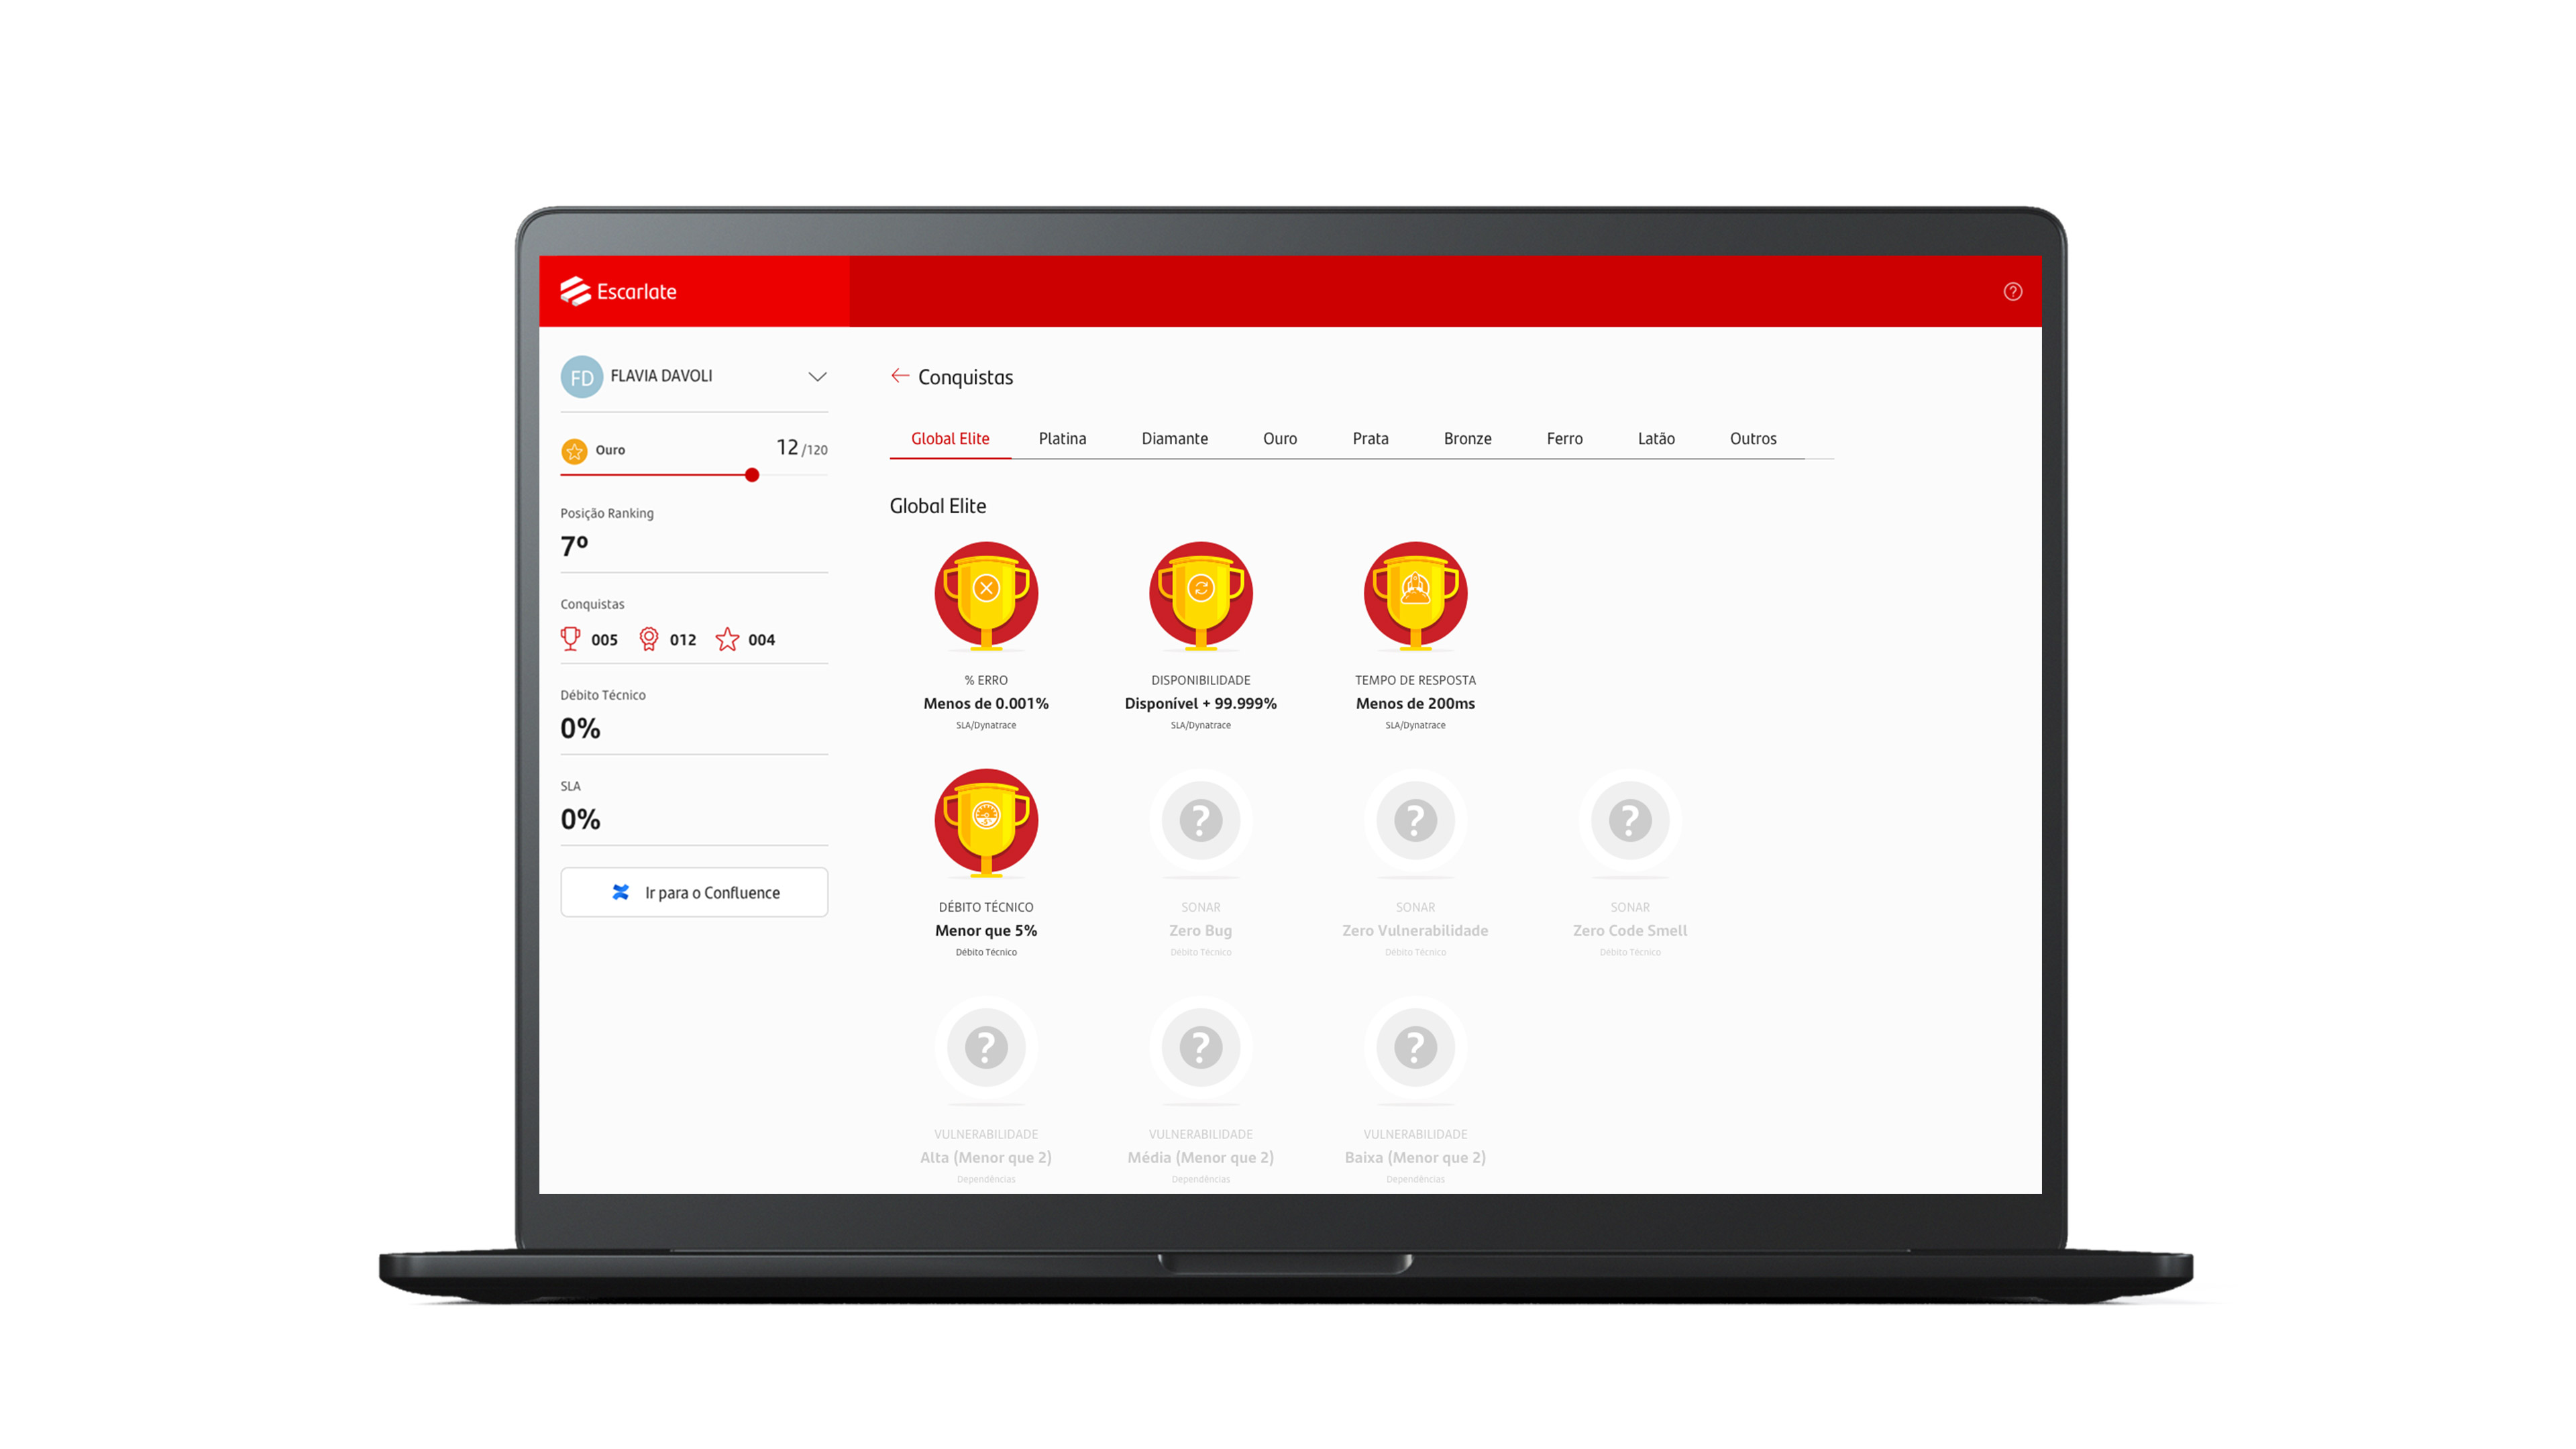
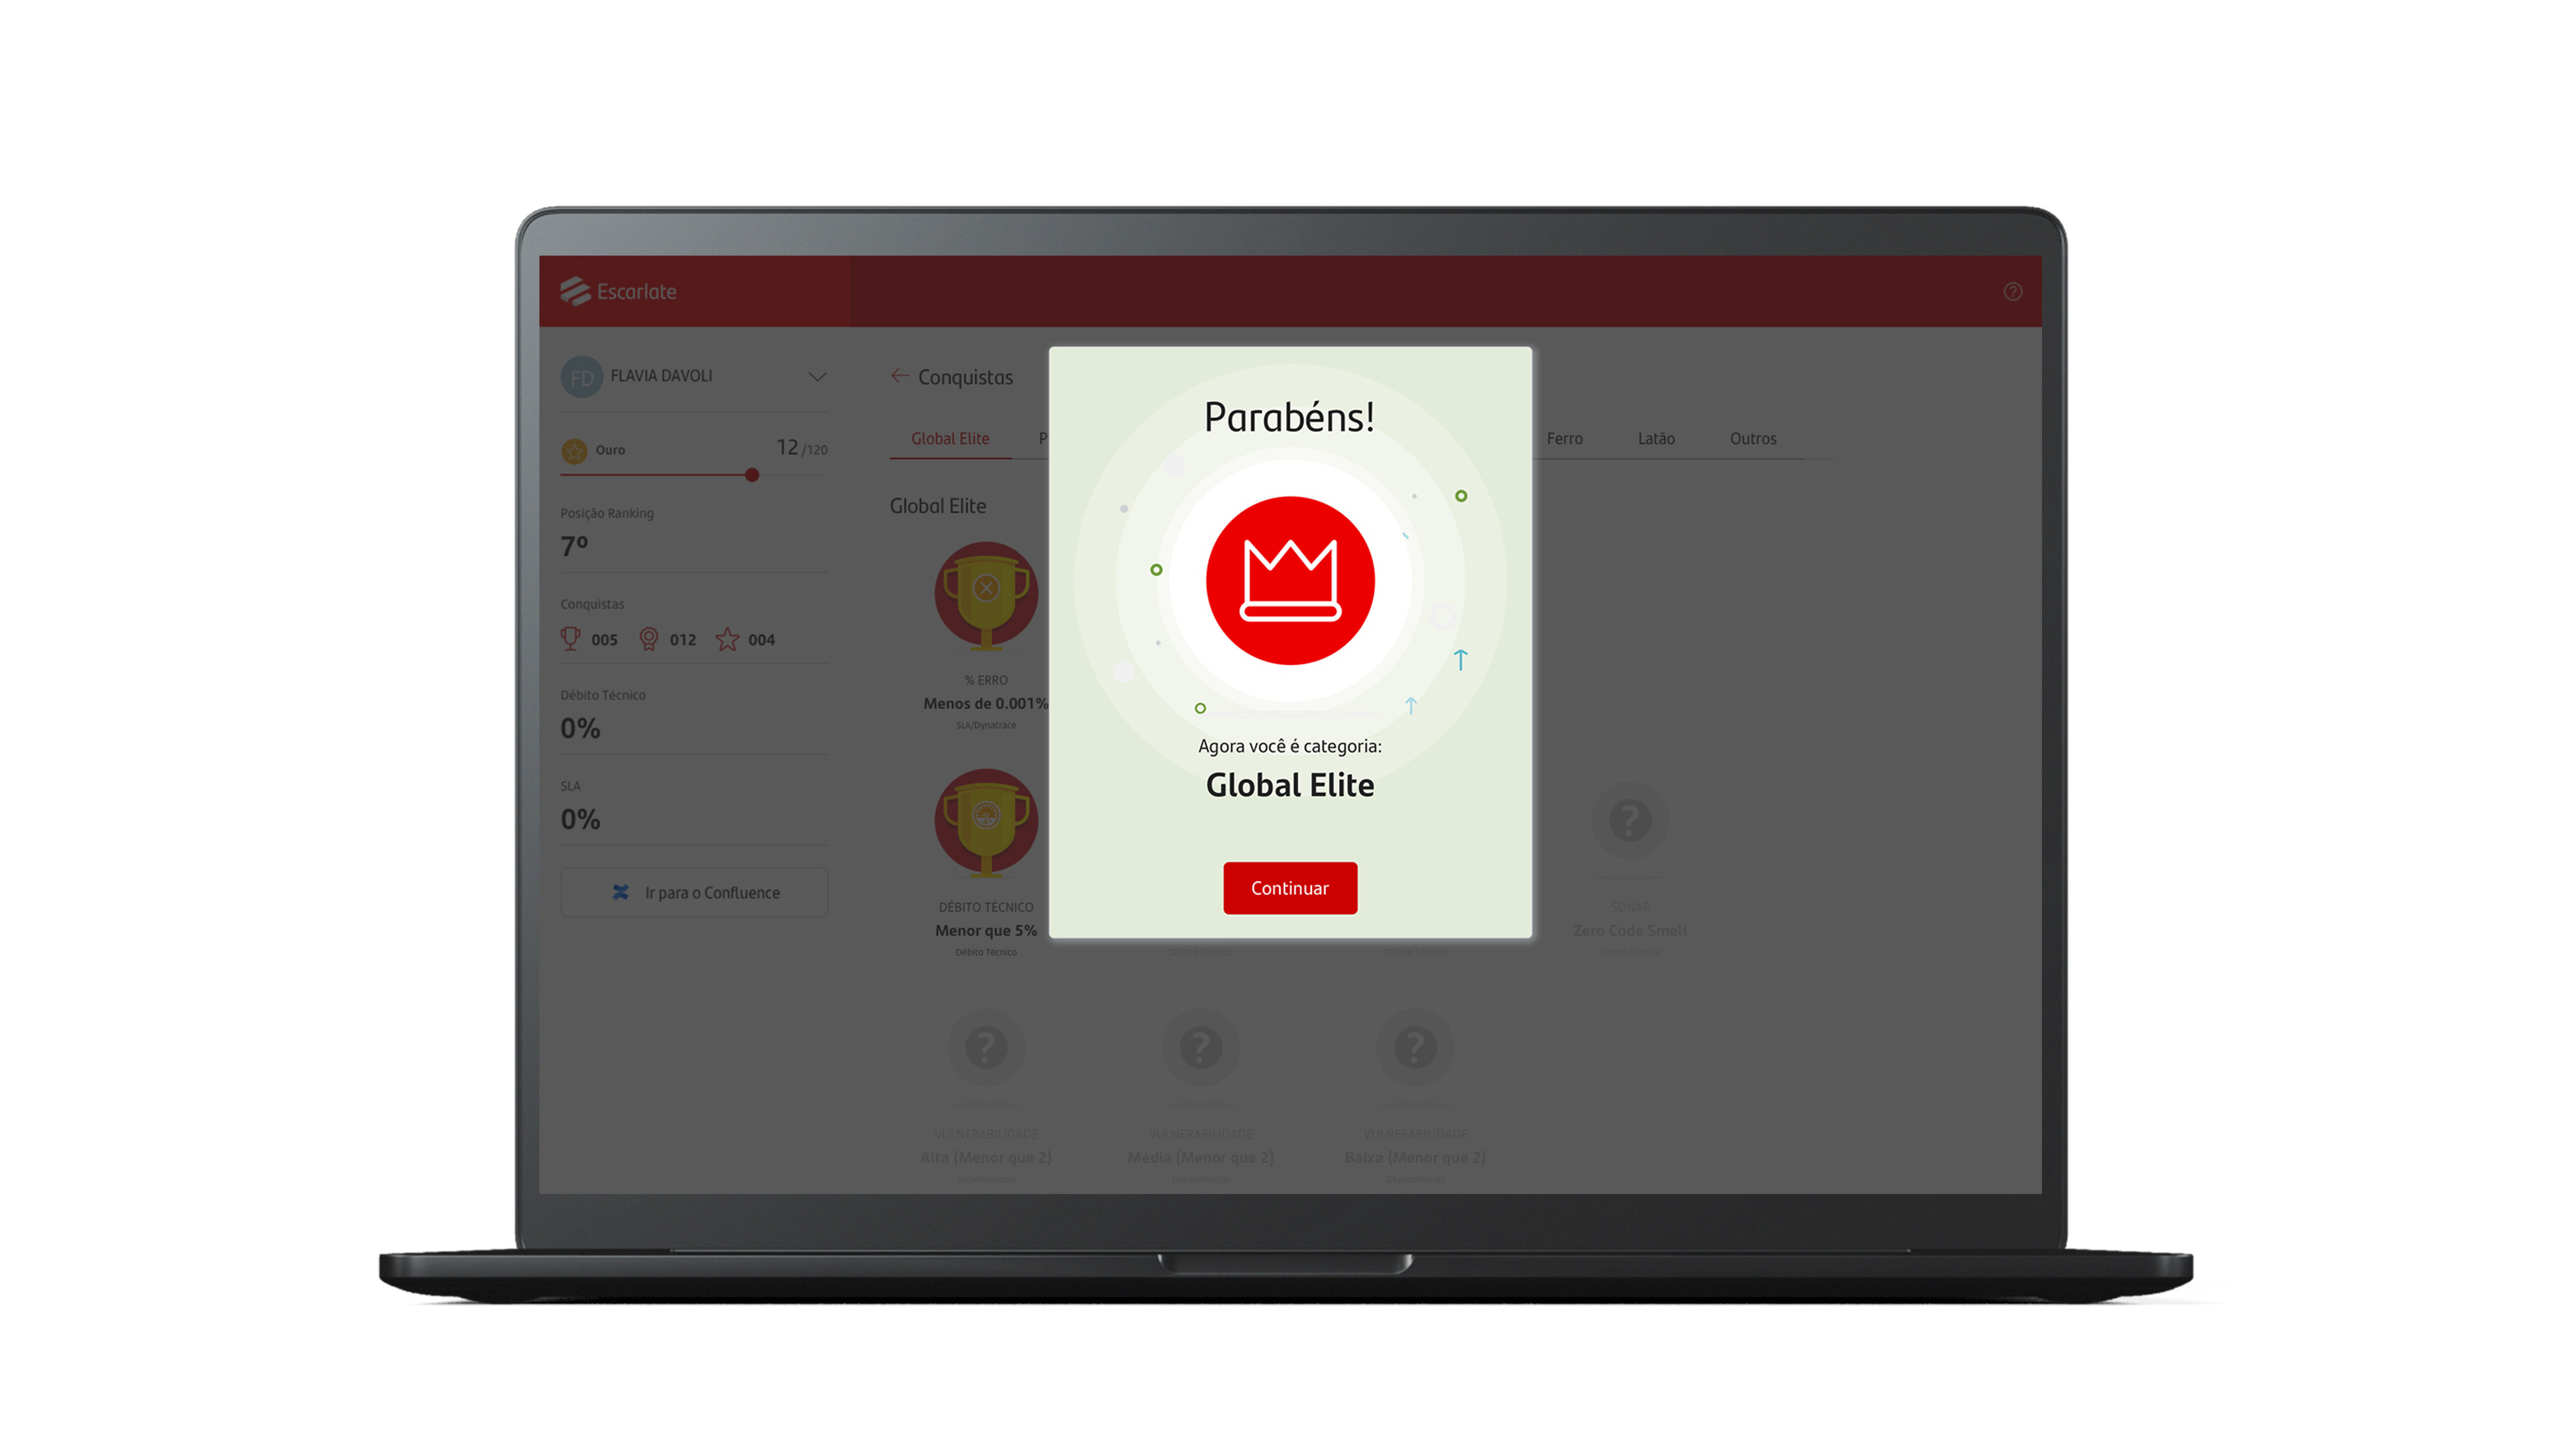
I developed the logo, based on the name "Scarlet", in reference to the color of the Santander brand, using a symbol to represent scalability. In addition to branding, I wrote the rules and set the scores based on each performance metric parameter together with the business team involved.
Highlights
The project was developed using the Flame Design System (developed by Banco Santander's own experience team).
Main Tasks
- → Conducting and following closely tests with users.
- → Interviews with users and stakeholders.
- → User interface and experience reviews.
- → Motion and micro-interactions.
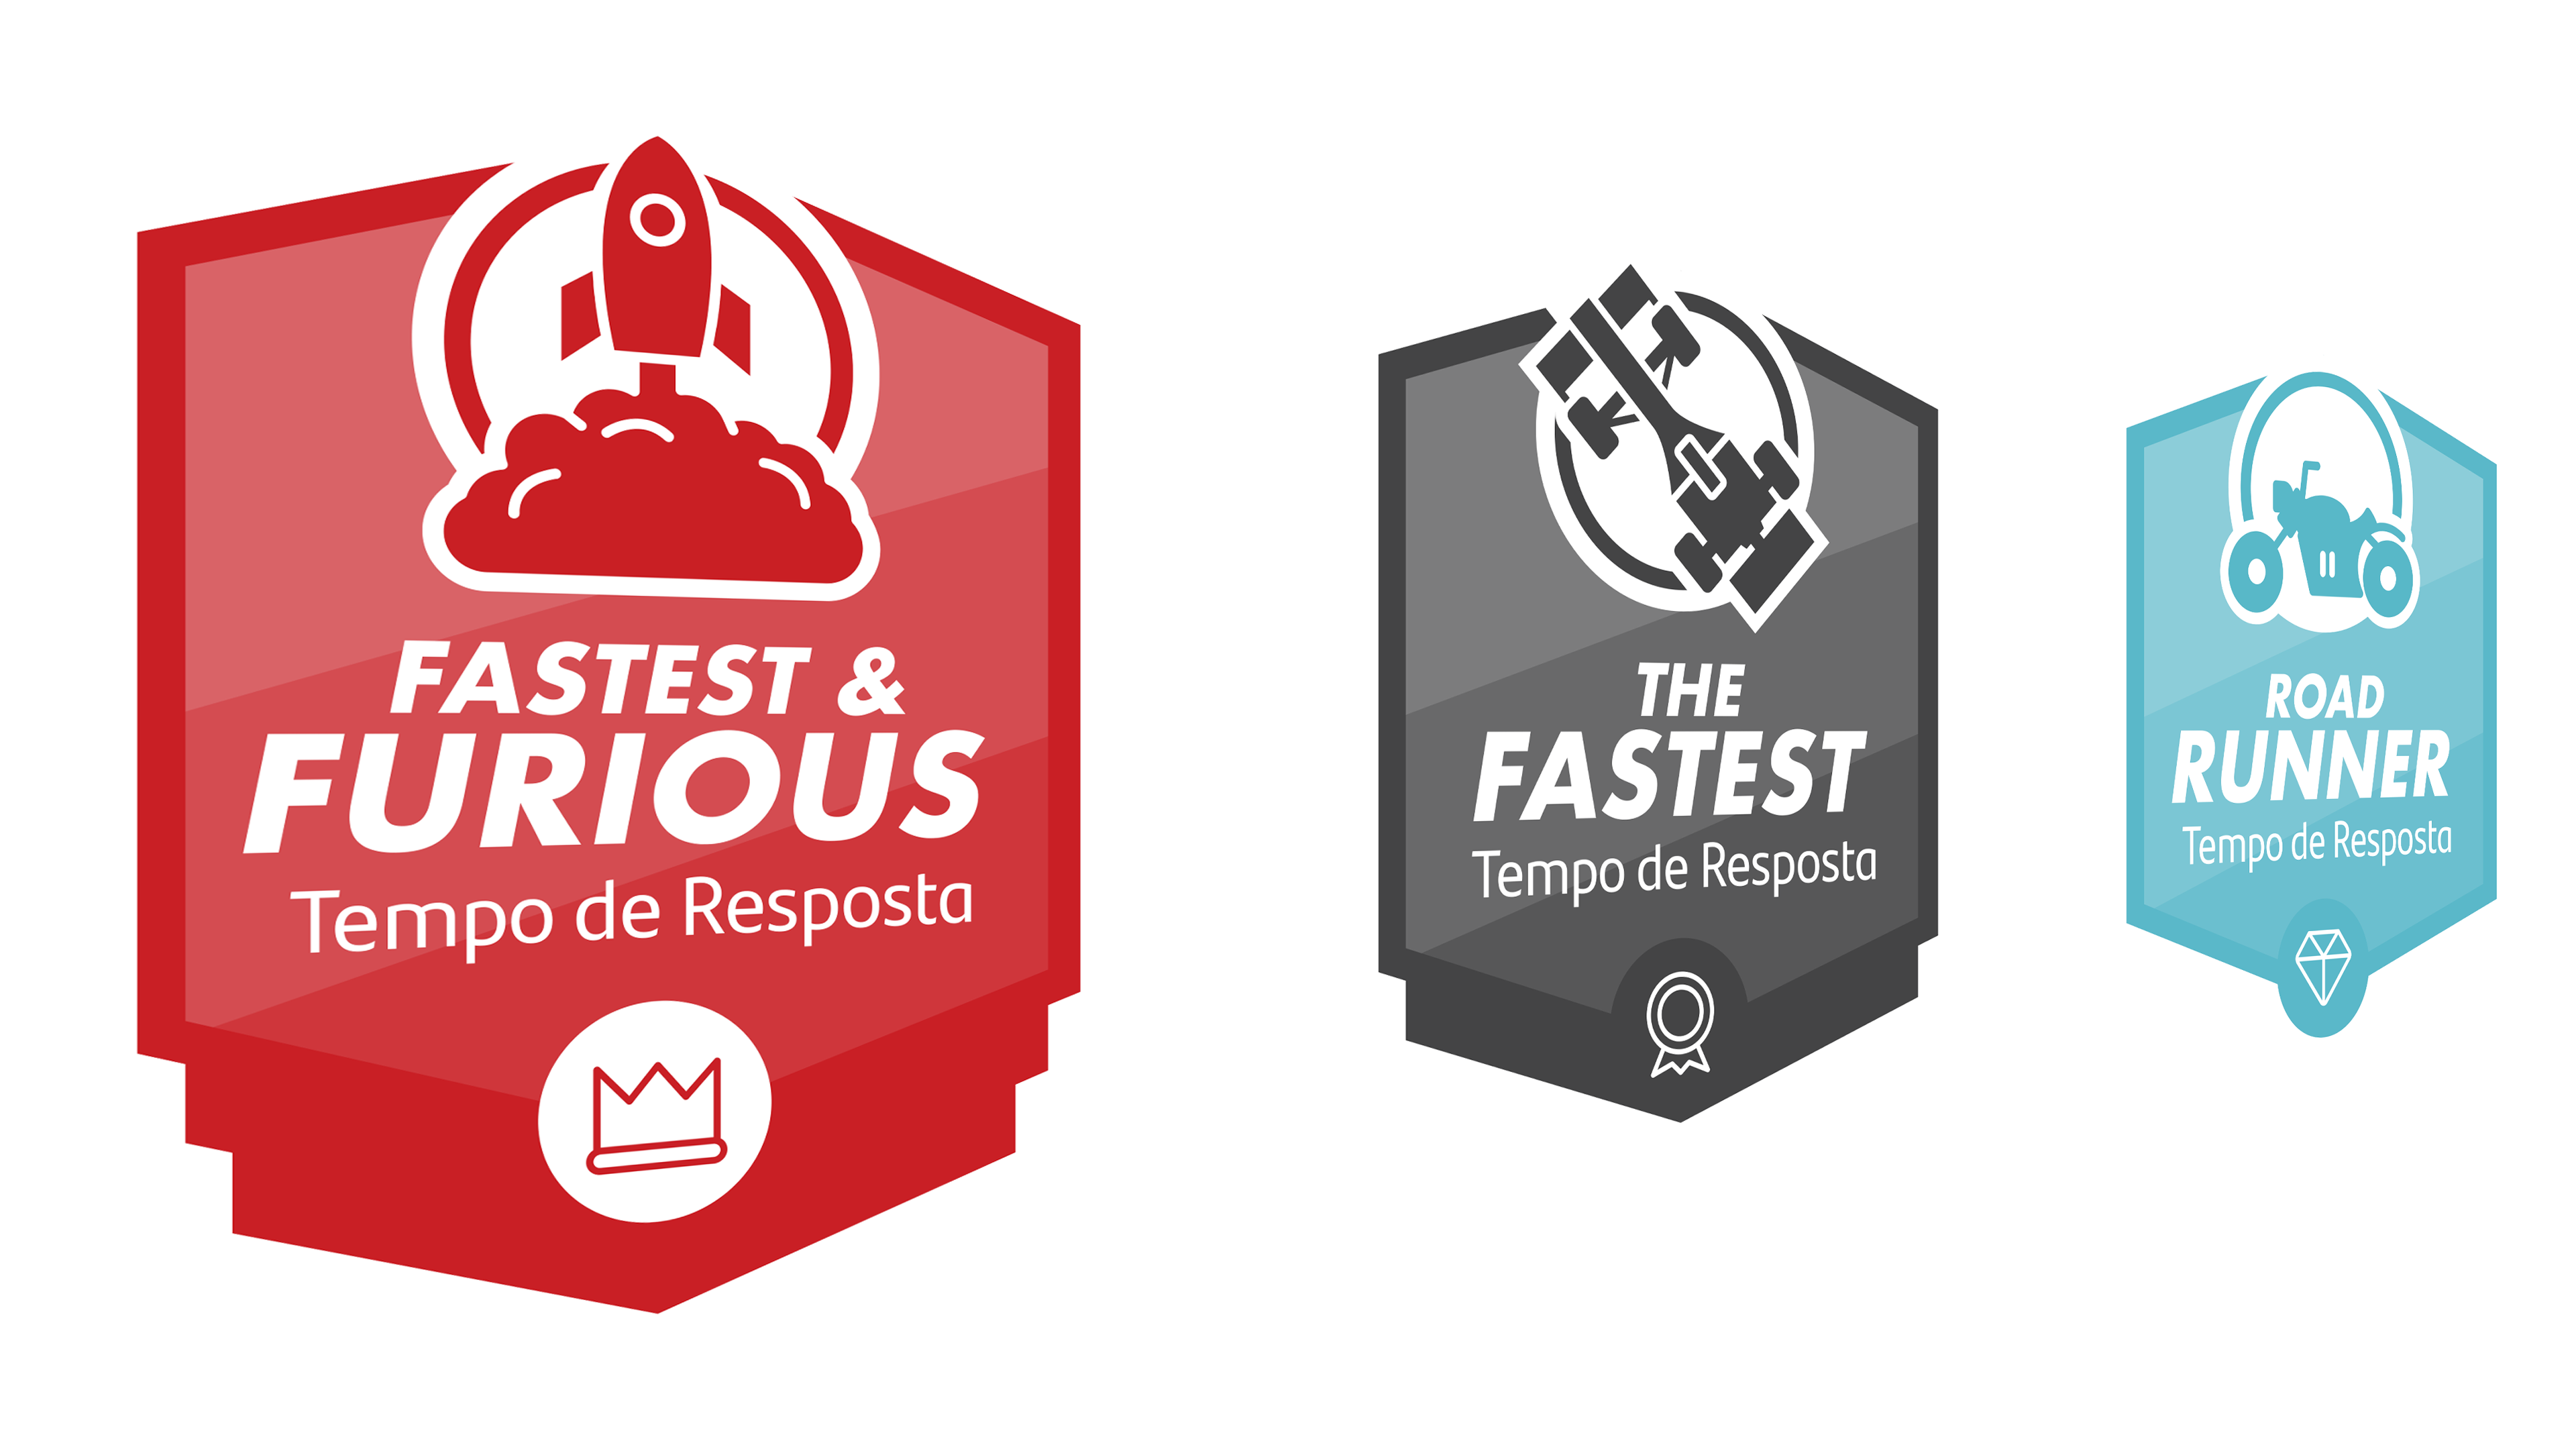
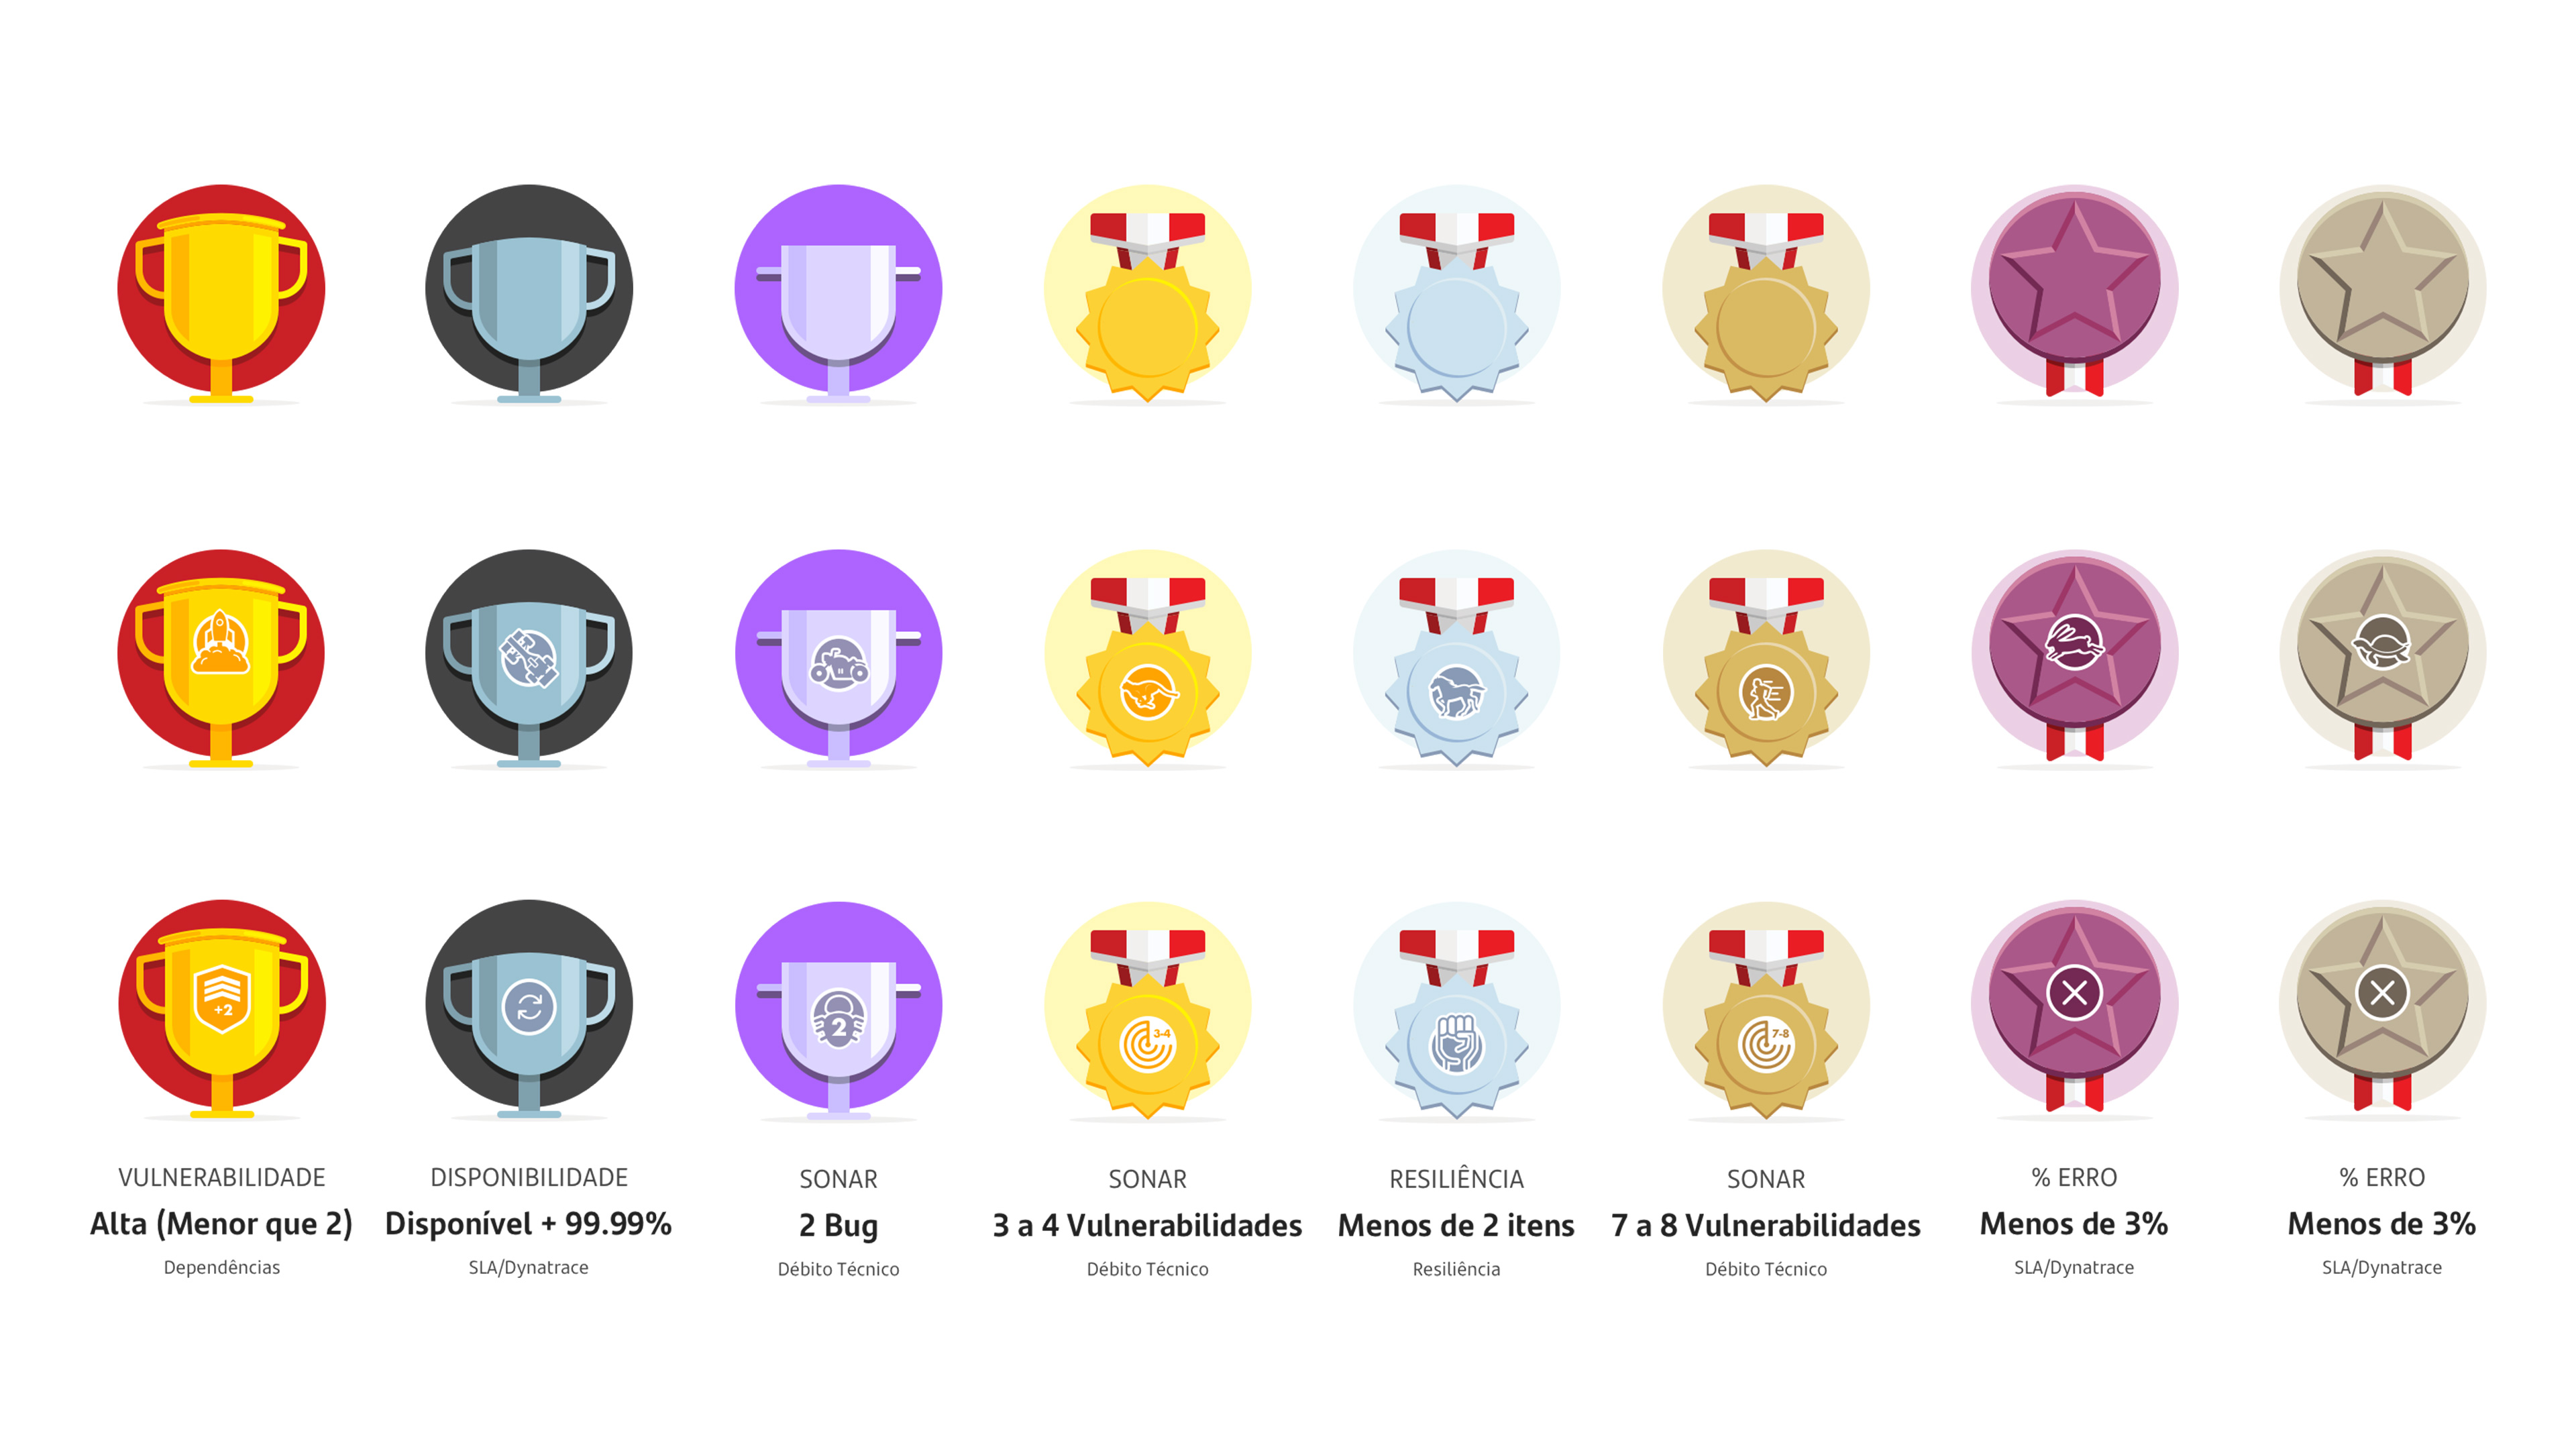
- → Illustrations.
- → Specifications and Documentation.
- → Partnering work with developers.
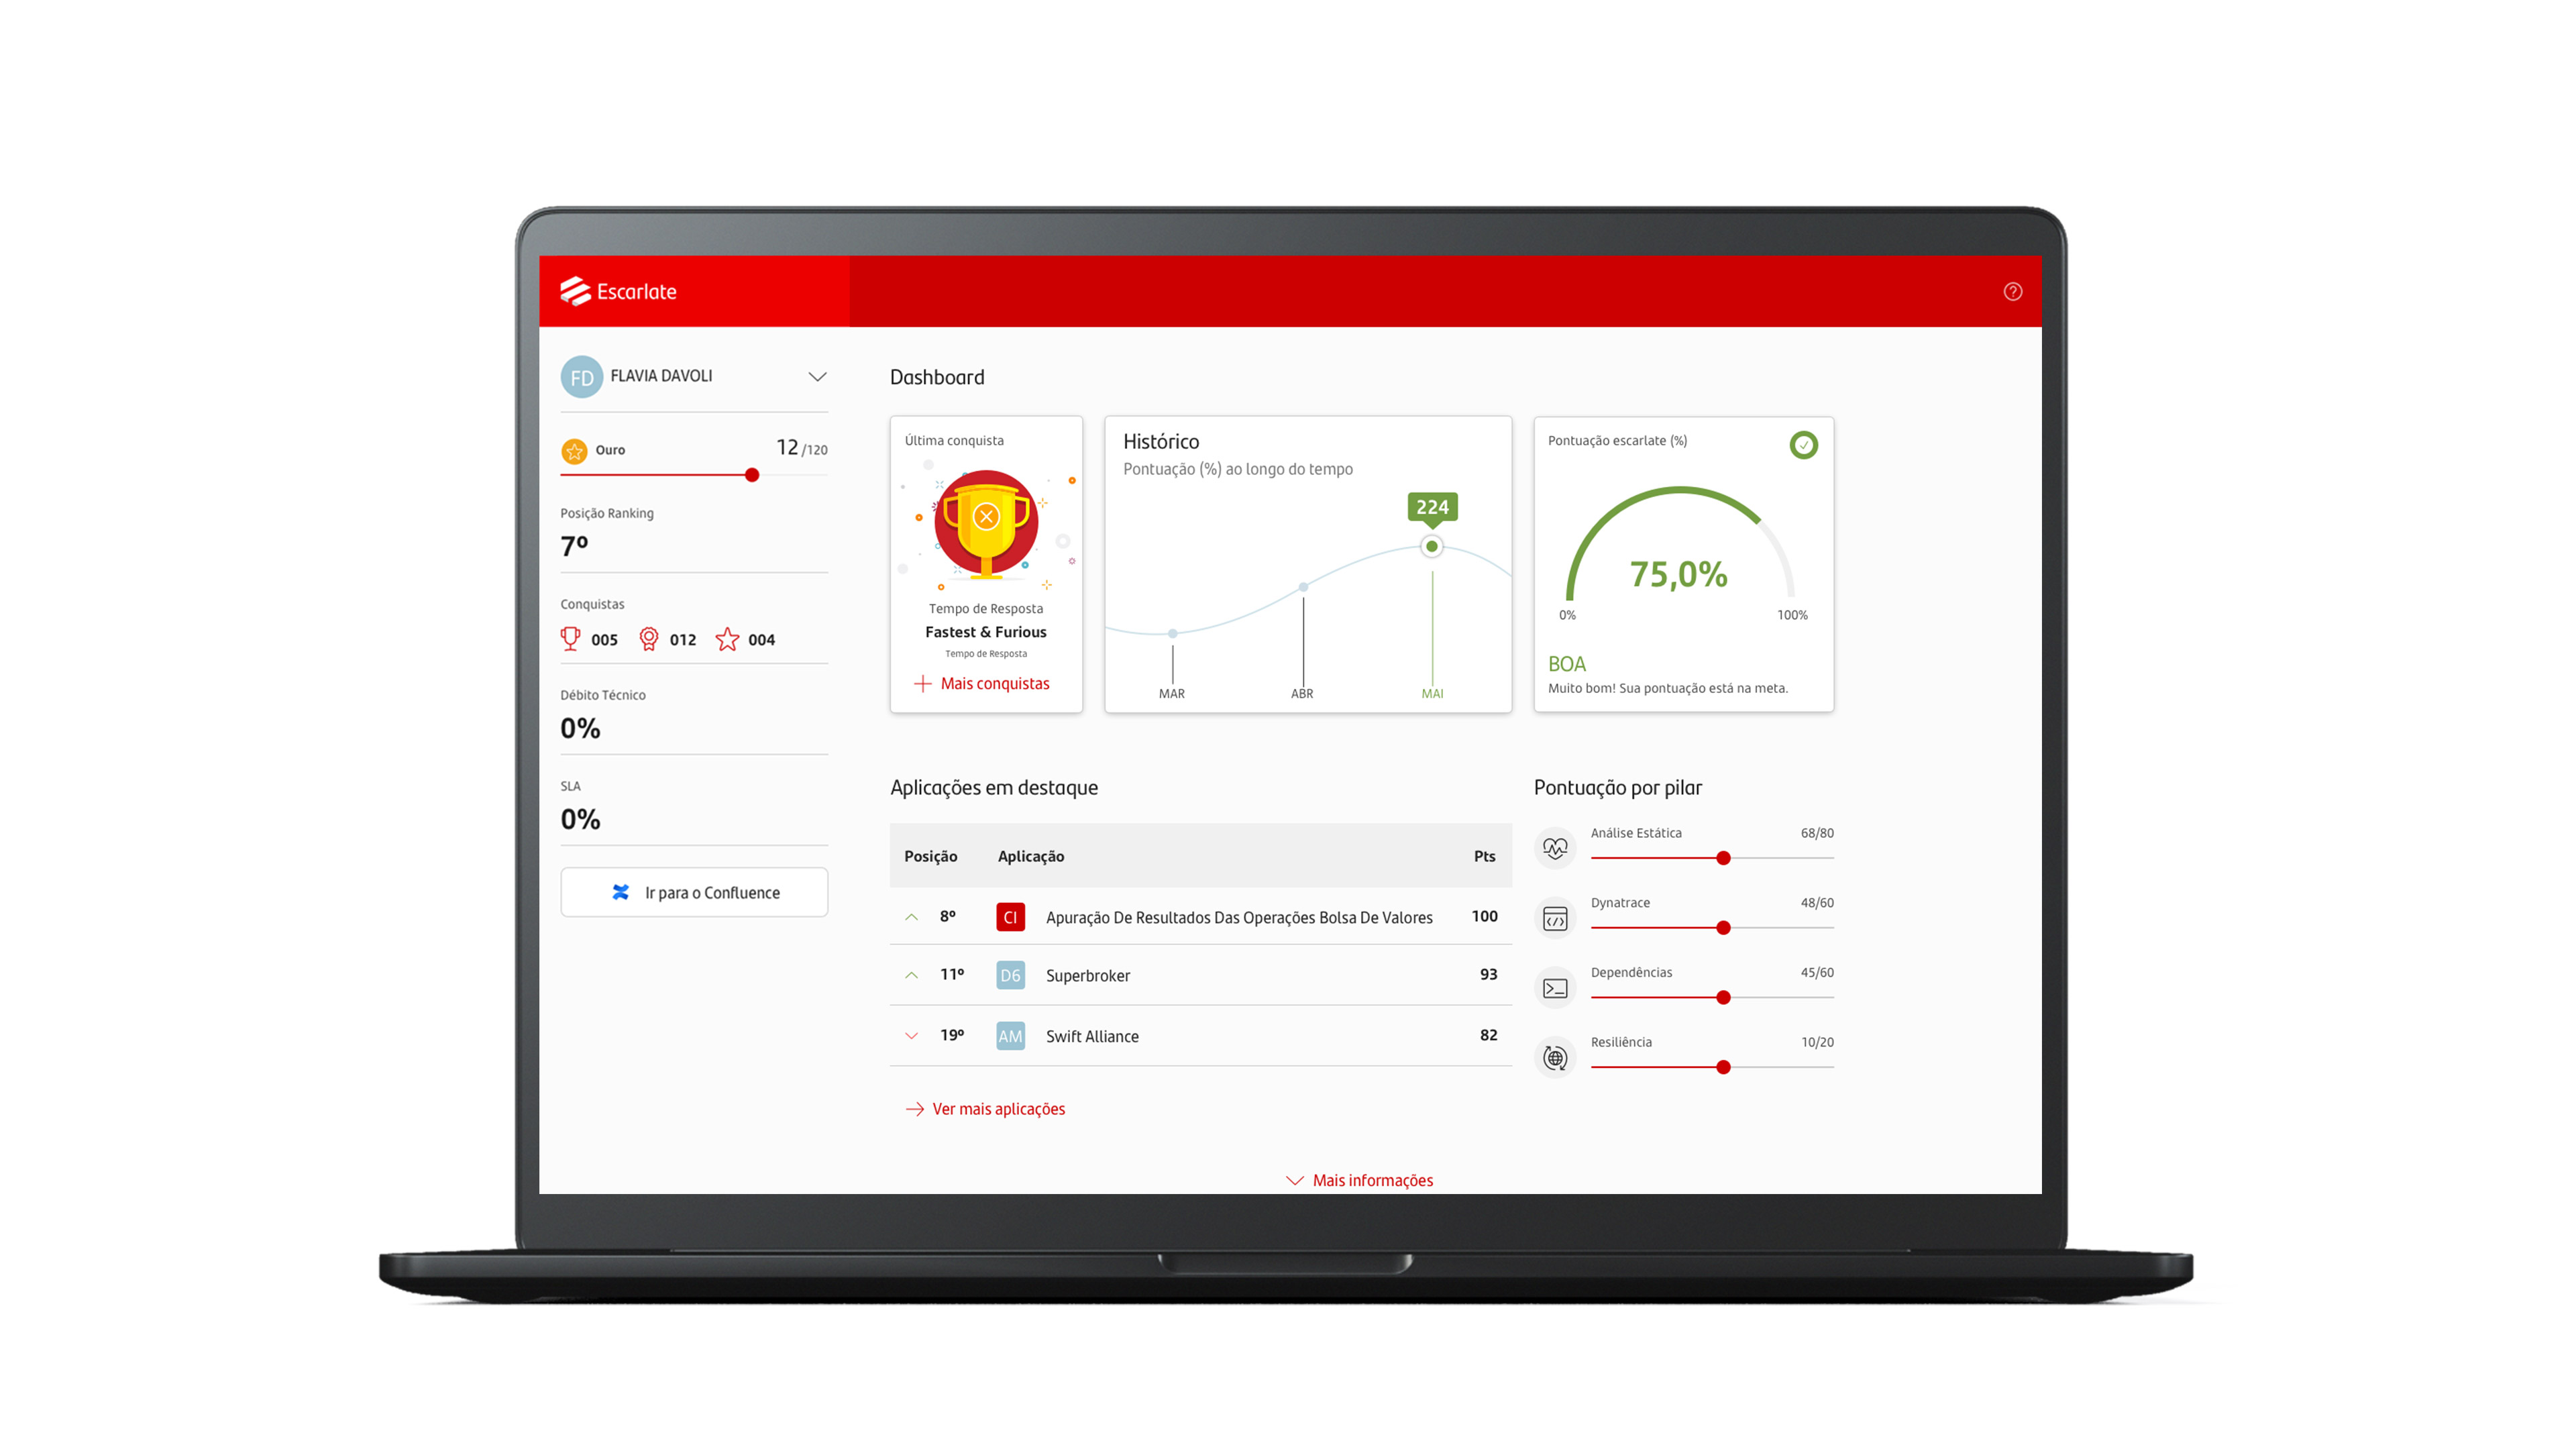
Dashboard
Design Process

Discover

Stakeholder interviews, user surveys, desk research, and workshops. To understand the problem and define the next steps.
Validating the problem
Periodically, the Bank's architecture department holds reporting and planning meetings. There were reports that these meetings were always tense and like "wash someone's dirty laundry in public", with a lot of demand for results. In addition, information and action plans were not very clear, especially for younger managers with generally abstract objectives.
Product Idea
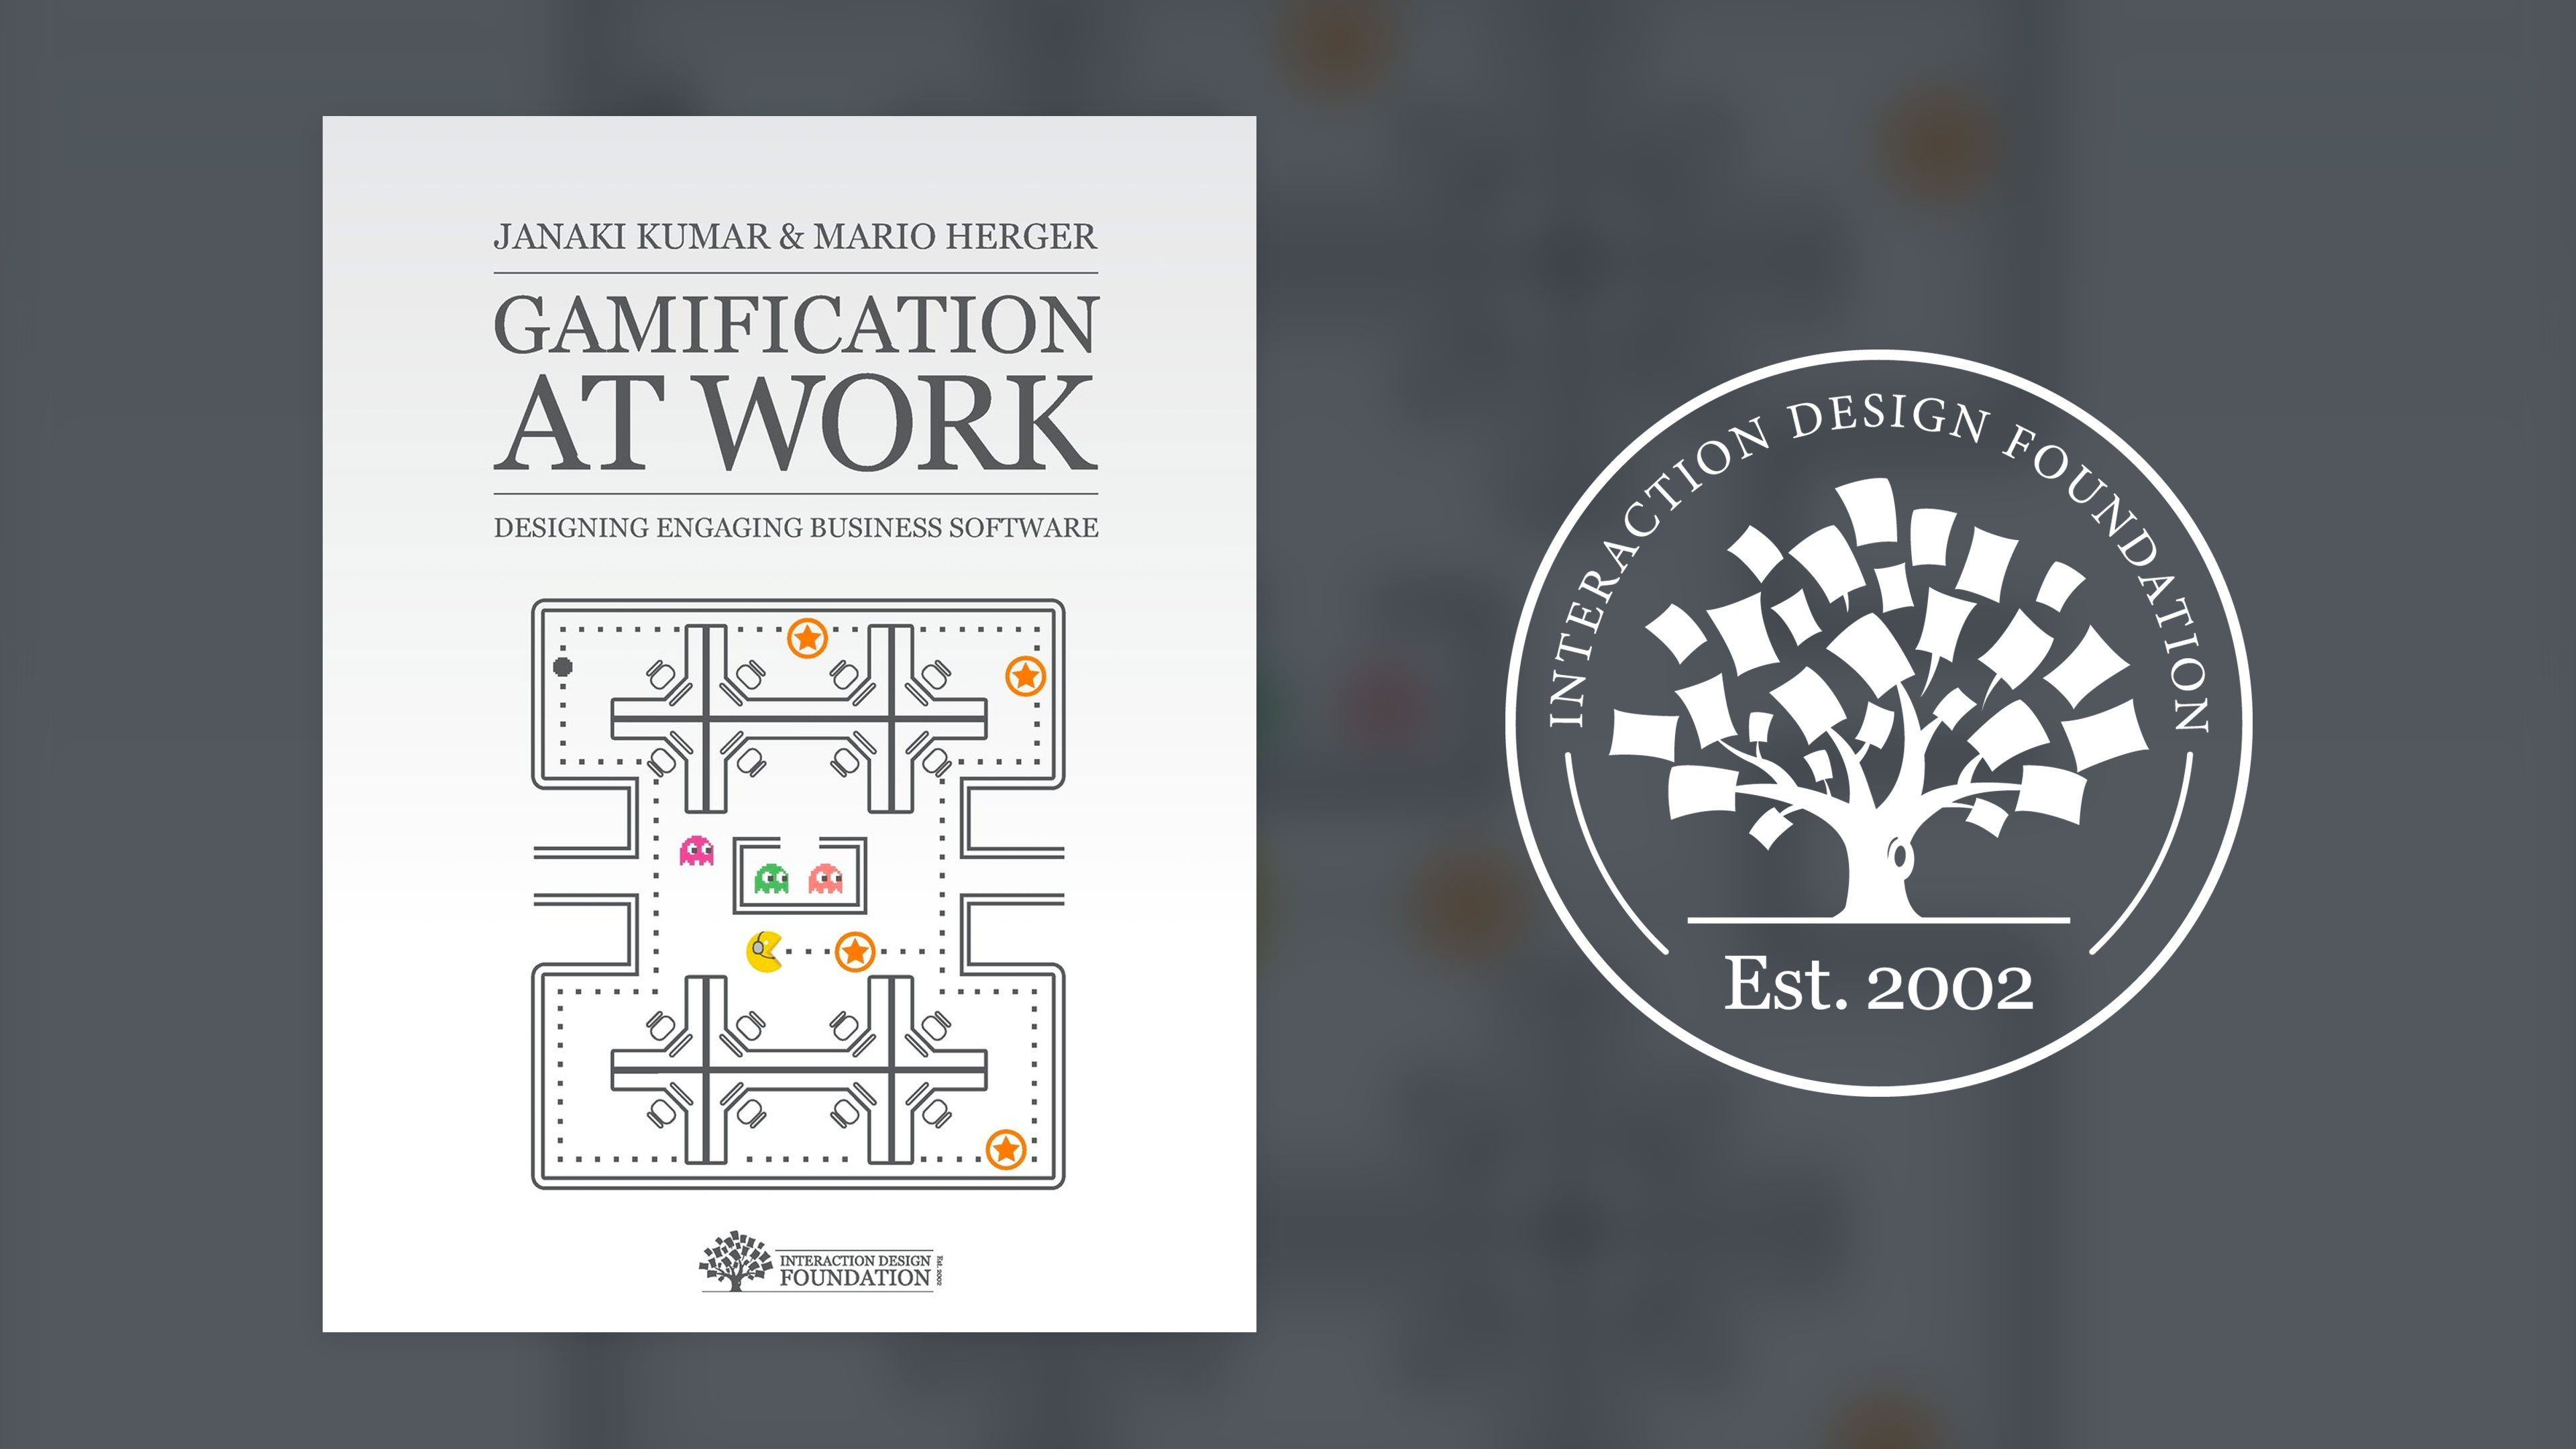
In an enlightened moment, by coincidence I was doing a training on gamification at the IDF (Interaction Design Foundation). So, nothing more natural than using what I was learning in the course in the project. I was able to put all the theory into practice with great confidence.
Develop
Research and testing was performed on demand with several superintendents who participated in the initiative, so approval was almost instantaneous with few adjustments.
Deliver
Documenting the process and collaborating with team members, this was the phase of looking at the entire flow and thinking through all the possible use and error cases. At that time, several refinements were made to deliver.
Application
Illustrations
Promo
Follow the process
Continually revisiting the steps to propose further improvements in flow and experience in a constant iterative process.
Results
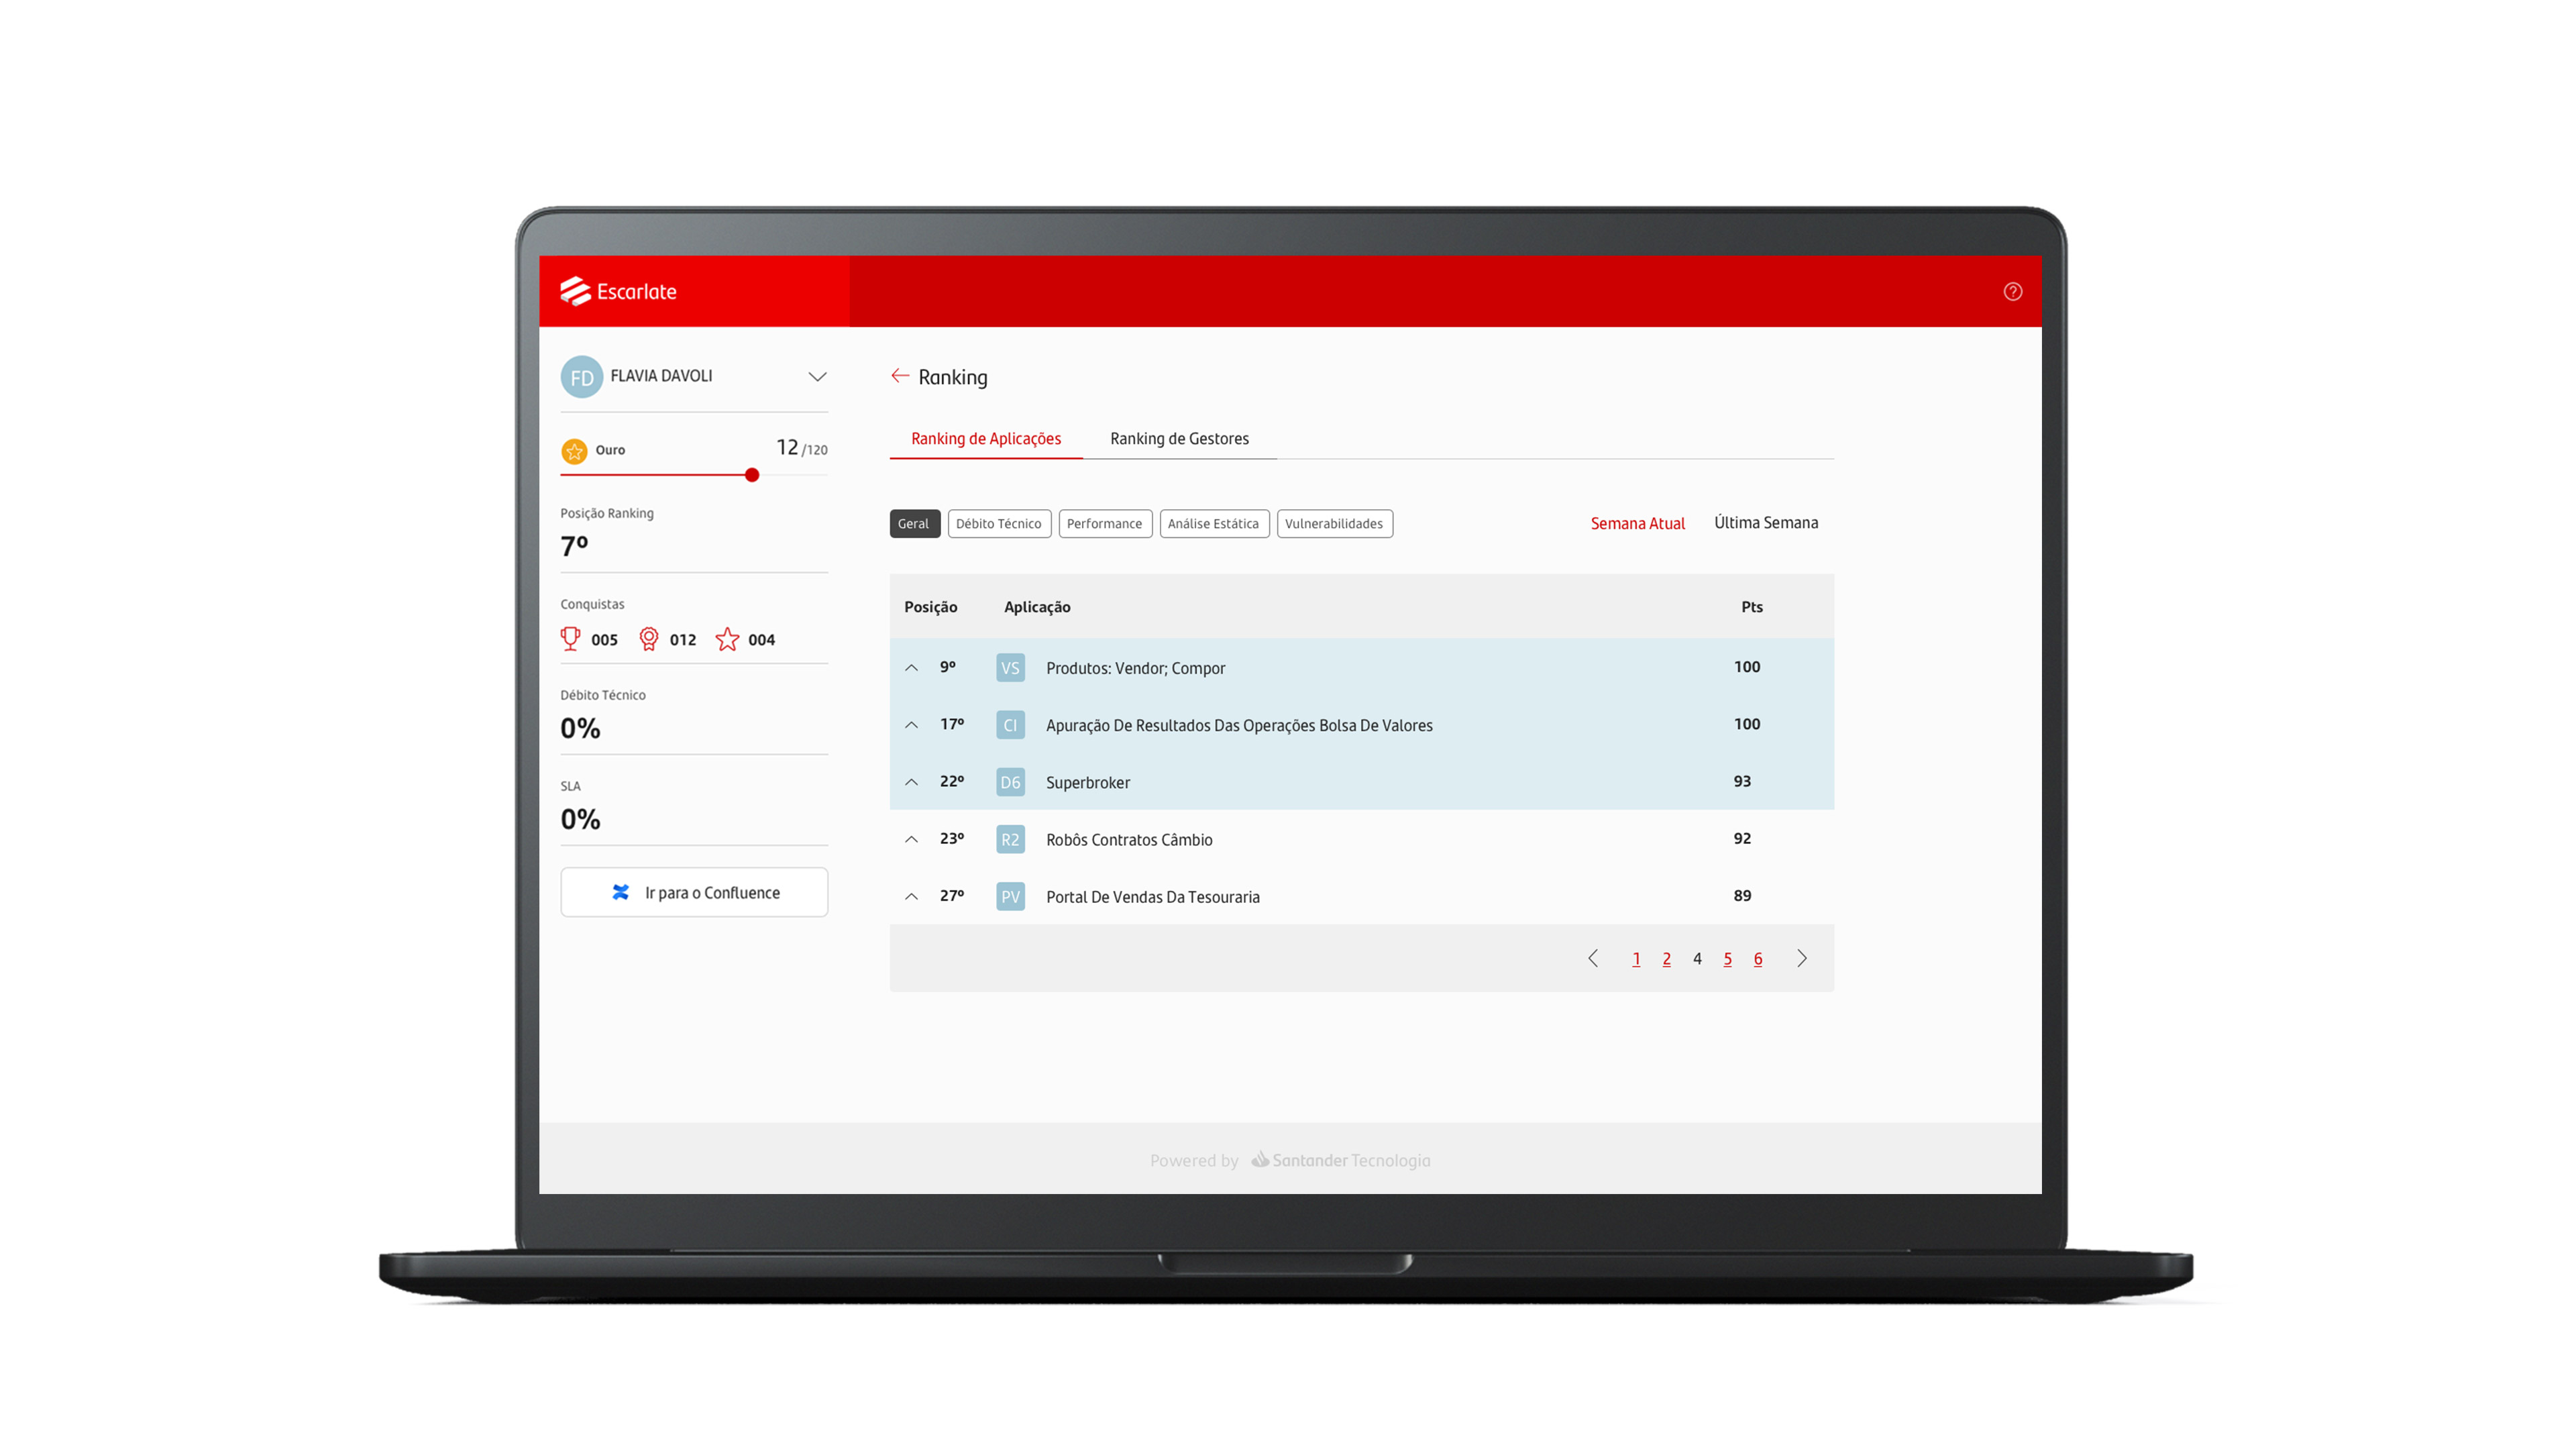
The parameterization and classification of performance items with a focus on ROI, with gamification and with clearer information has encouraged managers to monitor the results in more detail and, as expected, leveraged by the competition.
Internally indicated as good practices for other areas.
Now it's possible to identify greater visibility of which manager was responsible for each application.
An average 30% reduction in resources spent on each app from start to launch.
In a subsequent survey, it was highlighted that the meetings began to demand more results from the CTO, but with clearer objectives and more relaxed conversations.
